Contract Forecasting
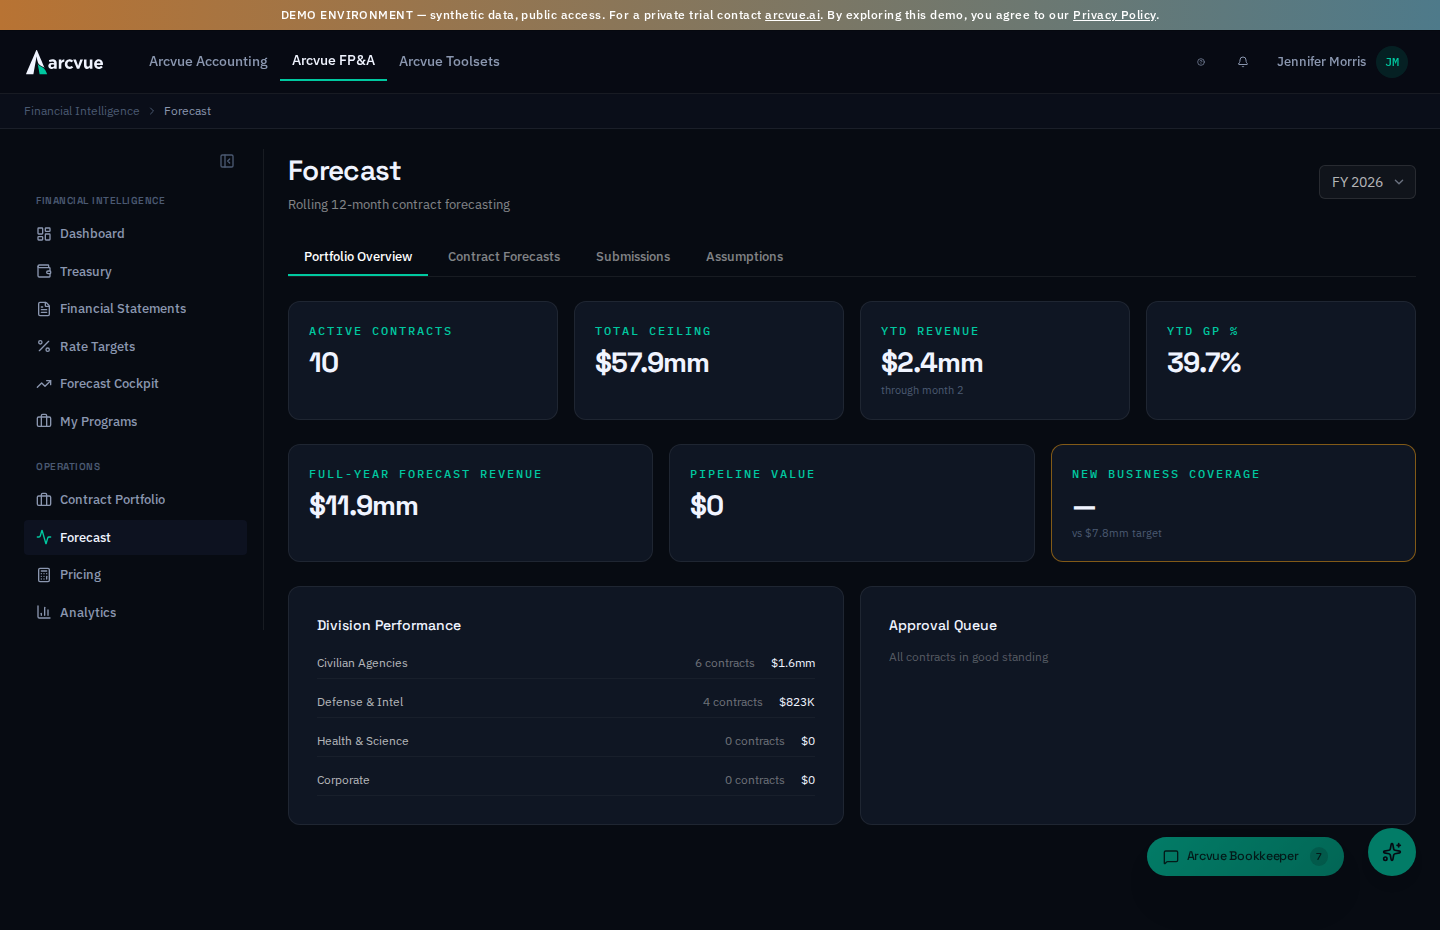
Build rolling 12-month contract-level forecasts month-by-month. Use prebuilt staffing calculators to derive labor and revenue from position data, or enter actuals directly. Lock forecast months to protect them from recompute, and track forecast lifecycle via draft/submitted/approved status workflow.
How to access
- In the left nav, open FP&A → Operations → Forecast (
/forecast), between Contract Portfolio and Pricing. You can also arrive from a contract drawer button elsewhere in FP&A, which opens that contract's forecast editor directly. - Choose a fiscal year from the dropdown in the top-right (
FY [year]selector). - You land on the Forecast Cockpit tab, where the shape of the forecast is set. Alongside it are Contract Forecasts, Budget Submissions, Growth Targets and Pipeline Forecast; users with admin-config access (CEO/CFO/finance- or operations-lead/admin) also see an Indirect Costs tab holding the division-level forecast Inputs and Parameters — relocated here from the Admin console. A link into that tab (the Dashboard's Budget Locked chip, the command palette, a bookmark) opened by any other role now shows a message naming who can open it, rather than silently landing you on another tab.
Pipeline Forecast tab
Immediately see rolling health metrics without opening individual contracts.
Click-path:
- On the Pipeline Forecast tab:
YTD Revenue/YTD GP %/Forecast Revenueshow aggregate picture.Active ContractsandTotal Ceilingcards summarize the book.Division Performancepanel breaks down by division.- Approval Queue (for leads) or Needs Attention (for all users) surfaces contracts flagged for review.
Key labels:
Active Contracts— count of unfunded or funded contracts (excluding expired).Total Ceiling— sum of all contract ceilings in scope.YTD Revenue— actuals through the most recent closed month.YTD GP %— gross profit margin on YTD actuals.Full-Year Forecast Revenue— engine projection for the full fiscal year.Pipeline Value— new business pipeline revenue time-phased into this fiscal year, not the lifetime value of every open pursuit. An opportunity whose period of performance starts in July contributes only its remaining months to this year's figure.New Business Coverage— ratio of pipeline to new business target; alert < 3x.Division Performance— table broken down by division name, active contract count, YTD revenue.Approval QueueorNeeds Attention— list of contracts with issues (staffing gaps, low funded runway or funding exhausted, low margins, missing actuals) or awaiting lead review. Funding flags key on the funded value, not the ceiling: a contract can sit far inside its ceiling and still be out of money.
How to know it worked: All KPIs match your prior month close and pipeline tracking. Alerts highlight contracts needing immediate attention (red) or caution (yellow).
Growth Targets
This tab moved here from Toolsets > Pipeline. Setting the new-business target and building the forecast that has to meet it are the same job, and they used to sit on two different screens. It is placed immediately before Pipeline Forecast, which measures coverage against what you set here.
- If more than one fiscal year is configured, pick the year with the FY buttons.
- The table lists each division with Revenue Target, GP %, New Wins YTD, % to Target (with a progress bar), and Notes.
- Edit inline: click the Revenue Target or GP % value, type a new number, and press Enter (Escape cancels). A toast confirms
Target updated. Generate from Annual Targetsspreads the annual figures into the monthly grid below.
The monthly section (FY[year] Monthly New Business Forecast) has three editable grids — Revenue, Gross Profit $, and a computed GP % — with a column per month and an Annual total. Edit any Revenue or GP cell to adjust that division-month.
The Annual total is not just a display: editing any monthly cell rolls it up into that division's annual Revenue Target, creating the annual row if the division did not have one yet. That annual figure is what Pipeline Coverage — and the Dashboard and Forecast coverage tiles — measure against, so a division whose targets you only ever entered monthly still counts.
What is behind a division's year-to-date number
Each row of the targets table is a Division, and each one opens. Click the chevron at the left of the row and the awards behind that division's New Wins YTD figure are listed underneath it.
That list is the audit trail for the percentage. The table tells you a division is at 62% of its Revenue Target; the expansion tells you which awards got it there.
| Column | What it holds |
|---|---|
| Win | The award, with its contract number beside it |
| Vehicle | The contract vehicle it was awarded under |
| Agency | The customer, with the sub-agency after a slash |
| NAICS | The code the work was competed under |
| Set-Aside | The socioeconomic category, if any |
| PoP | The period of performance |
| Role | Prime or subcontractor — and, in parentheses, who you teamed with |
| Company Value | What the award is worth to your company |
| YTD Contribution | The part of it landing in this fiscal year |
The last two columns are two different numbers and only one of them moves THE TARGET. YTD Contribution is what rolls into New Wins YTD and therefore into the percentage. Company Value is the whole award.
A five-year award shows a large Company Value beside a much smaller YTD Contribution, and that is correct — most of it is earned in later years. Reading the larger figure as progress overstates the year, which is the one mistake this screen makes easy.
A win with no company value recorded shows an em dash there. YTD Contribution is always a figure, because it is the number the roll-up used.
A division with no wins yet has nothing to expand. The block appears only when there is at least one award, so a row that does not open is telling you the year has not started for that division — it is not a fault.
New business build-up (Pipeline Forecast tab)
Below the contract health cards, the Pipeline Forecast tab builds next year's new business up from the pipeline, one opportunity at a time — every active pursuit at company value × PWIN, phased from its award date — and sets that against the growth target already entered.
This is the bottoms-up half of new-business planning. The top-down half (growth target ÷ unweighted pipeline) lives on the Coverage Matrix. The two describe the same pipeline, so the point of the screen is the bridge between them: what the pipeline explains, what the plan asked for, and the difference named.
The reconciliation bar
One bar per division. The track is the target; the fill is what the weighted pipeline explains. The fill is deliberately not capped — a division whose pipeline supports more than was planned runs past the target marker, which is usually the most interesting row on the screen.
The gap between them is the unidentified balance: the "bluebird" line a hand-built waterfall carries. It is computed, never entered, and it is allowed to be negative.
Which pursuits the forecast leans on
The pipeline and the forecast set are not the same thing. Every active pursuit is listed. The ones you are comfortable building a number on are usually a subset.
Expand a division and each pursuit carries a checkbox in the first column:
- Checked — in the forecast. Its weighted revenue is in the bar, the totals and the reconciliation.
- Unchecked — left out. The row stays on screen, struck through, still showing its own value and PWIN, and its money leaves every total.
The usual reason to leave one out is size and binary outcome: a very large opportunity is genuinely all-or-nothing, and no PWIN captures that. Weighting it at 40% produces a number that will never happen either way. Excluding it says "real, but not something I will build a forecast on" — it does not say the opportunity is gone.
Nothing here writes back to NEO. The pursuit keeps its stage, its PWIN, its capture team and its place in the pipeline. These decisions belong to the forecast and are invisible to everyone working the pipeline. One control on this screen does write, and it is not this one: Adopt as target, below.
New pursuits are included by default, so a growing pipeline never needs curating before the screen will total.
The baseline, and alternates
Exactly one saved view per plan year is the baseline — the forecast the business is working from. It is marked with a dot and sorts first.
Everything else is an alternate, which is what lets you move levers and drop pursuits without disturbing the number anyone else is quoting.
| To do this | Do that |
|---|---|
| Establish the baseline | Uncheck your first pursuit, or save with Baseline ticked. The first thing saved for a year becomes the baseline automatically. |
| Try a harsher case | Set the levers, save it under a name with Baseline unticked, then adjust its checkboxes. |
| Switch views | Click a saved chip. The levers and the inclusion set both load. |
| Promote an alternate | Hover its chip and click the dot. The old baseline stays, as an alternate. |
| Get back to the baseline | Reset to the baseline. |
A chip shows −3 when that view leaves three pursuits out.
The baseline cannot be deleted — deleting it would discard every inclusion decision the forecast rests on and silently fall back to "everything included". Promote another view first, or clear its exclusions.
The levers
Award slip moves every award date later; PWIN haircut subtracts points from
every score. Both are sensitivities, not edits — nothing is written to the
pipeline, and the build-up recomputes against today's data every time you open
it.
A saved view stores its levers, not its answer. Loading one re-runs it
against the current pipeline, so a case saved in March does not quietly report
March's numbers in September. Moving a lever away from a saved value drops the
chip's highlight; an explicit 0 overrides a saved lever rather than being read
as "unset".
Adopt as target — the one control here that writes
The dialog is headed Adopt the build-up as your target until it has run; once it has, the same dialog re-titles itself What changed and shows the before-and-after. So the heading tells you which side of the write you are on — if it still says adopt, nothing has been written yet.
The panel is headed New business, built up from the pipeline, and
everything on it is a sensitivity — except one control.
Adopt as target is not a sensitivity.
The growth target is labeled as entered, because a person typed it. The
build-up beside it is computed from the pipeline. Adopting crosses that line: it
takes the bottoms-up number and makes it the top-down target — which changes
the denominator of every coverage ratio in the product, including the
New Business Coverage alert on the cockpit.
So it is two steps on purpose. The first shows the two numbers you are choosing between. The second reports what actually happened, division by division — and the refusals are the part to read. A division the server declined to touch keeps the target its planner set, and you need to see that it was left alone rather than discover it later.
There is no preview of what will change, and that is deliberate. Whether a division has a growth-target row at all is a fact only the server holds, so a preview would have to guess — and one that is confidently wrong about a single row is worse than none. Read the second step, not the first, to learn what changed. Done closes it; Cancel on the first step writes nothing.
When the screen has nothing to show you
Two empty states, and they mean opposite things:
-
Nothing to build up yet — no division carries a growth target for the plan year, and no active pursuit is assigned to a division. There is nothing to set against anything. Enter new-business targets on the Growth Targets tab, and give the pursuits in your pipeline a division.
The screen's own wording here points at an Assumptions tab. No tab carries that name — the Forecast tabs are Forecast Cockpit, Contract Forecasts, Budget Submissions, Growth Targets, Pipeline Forecast and Indirect Costs. Go to Growth Targets.
-
No pursuit can be forecast yet — the pursuits are there and every one is missing at least one of the three inputs a build-up needs. The screen counts them for you and lists which input each is short of. This is a data-entry job with a known size, not a problem with the forecast.
Do not read the second as the first. The first means nothing is set up; the second means everything is set up and the data is incomplete, and the remedies are different.
The three inputs, and what a missing one costs you:
| The row says | What it means |
|---|---|
| In the forecast | Valued, dated and scored — it counts. |
| Needs a PWIN | Counts toward coverage, and contributes nothing to the build-up until someone scores it. That gap between the two numbers is exactly this row. |
| Needs an award date | Revenue phases from the award date, so without one there is no month to put it in. |
| Needs a company value | Our share of the program — not the ceiling. |
Saving a sensitivity
Name for this sensitivity is the field; Save these levers is the button. The saved view stores the levers and the inclusion set, never the answer — see The levers above for why that matters. Revenue starts is the per-pursuit column showing the month its money begins, which is the award date plus any Award slip you have applied.
The whole forecast period
At the bottom, one table shows weighted new business by division across every year the pipeline reaches — the plan year and the ones after it — with a row total and a column total.
The plan year column is the same figure the bars above reconcile, by construction: both read the engine's division roll-up rather than each summing the lines separately.
Excluded pursuits are absent here for the same reason they are absent above. The footnote states how many are out and what they are worth at full company value, so the number is never quietly smaller with nothing explaining why.
Lines that cannot forecast yet
A pursuit is listed even when it cannot contribute, tagged with the first thing that has to change:
| Tag | Meaning |
|---|---|
Needs a PWIN | Counts toward coverage; contributes nothing until scored. |
Needs an award date | Revenue phases from the award date; without one there is no month to put it in. |
Needs a company value | Our share of the program — not the ceiling. |
They are shown rather than dropped on purpose: a confident total computed over a fraction of the pipeline is the failure this screen exists to prevent.
The year selector
The FY dropdown offers the current year and the two after it. Last year is
in the past and has no bearing on a pipeline.
Contract Forecasts tab
Open, edit, and manage individual contract forecasts.
Click-path:
- Click the Contract Forecasts tab.
- (Optional) Search by contract name or number using the search field.
- (Optional) Toggle
Show Expiredto include closed contracts. - Review the contract table; columns include:
Contract— contract name / number, client, division.Ceiling— contract ceiling amount.YTD Revenue— actuals through close month.Forecast Rev— engine projection for the full year.GP %— gross profit margin on actuals (red < 15%, yellow < 20%).Status—DRAFT(yellow),SUBMITTED(blue),APPROVED(green), orNONE(gray).
- Click the
Infoicon (ⓘ) on any row to open the contract info drawer (read-only summary). - Click
Openbutton to launch the full forecast editor (Layer 2).
How to know it worked: All contracts in your portfolio are visible, searchable, and sortable by status. Clicking Info shows contract profile, financial summary, and forecast status.
Forecast editor (Layer 2: Focus Mode)
Edit the 8-row monthly grid for a single contract. This is where you build the rolling forecast.
Click-path to enter the editor:
- From Contract Forecasts tab, click
Openon any row. - The editor opens in focus mode (full-screen).
- You land on the Forecast Grid sub-tab (default).
Editor header (always visible):
- Contract name, division, client, and current status (
DRAFT,SUBMITTED, orAPPROVED). - Sandbox toggle — enter sandbox mode to test changes without committing.
- Prior Year toggle — overlay prior-year actuals below the grid for reference.
- Copy from... selector — if actuals are present, copy a closed month forward to forecast months.
- Save button (enabled when you make changes).
- Submit button (when status is
DRAFTand no unsaved changes). - Approve / Return buttons (lead role only, when status is
SUBMITTED).
Contract Settings (collapsible section):
- Click the settings row to expand:
Recompete(Yes/No) — engine assumes this contract recompetes at PoP end.p(win) %— probability of win (0–100).Annual Growth %— year-over-year revenue escalation (drives outyear forecasts).Recompete Size %— % of current revenue if the recompete is won (100% = same size).Transition Months— months of overlap during recompete transition.Successor Contract— link this contract to its recompete award (optional).
- Click
Save Settingsto persist; settings drive the Summary tab projections.
When a forecast edit breaks a growth target
Saving an edit that no longer adds up to the division's growth target opens Rebalance growth targets. It is not a warning you click past — it is asking which of two different things you meant, and the two are not variations of each other.
Rebalance keeps the annual target and moves the money. The table shows one row per Month, with Current rev beside Proposed rev, so you can see exactly which months absorb the change. The division's annual figure does not move.
Let total change does the opposite: it skips the growth-target write
altogether and lets the division's annual total move. That is the right
answer when the plan genuinely changed, and the wrong one when you were only
re-phasing work across months. The screen offers both as equal options and
does not tell you which you want — that is the judgment you are being asked
for.
When the change does not fit
Sometimes the rebalance cannot be absorbed by the remaining months. The modal then offers three resolutions, and only the ones that are actually possible for your situation can be chosen:
- Accept a negative month — take the shortfall where it falls.
- Spread it across the other open months — divide it over the months still open.
- Push it into next year — move it beyond the current fiscal year.
Editing the proposal yourself
Custom lets you type over the proposed monthly figures instead of accepting the arithmetic. A custom edit deliberately applies no overflow resolution — you have already decided where the money sits, so nothing further is moved on your behalf. Cancel closes without writing anything.
Reading the numbers
Deltas print in accounting parentheses: a reduction of four thousand shows
as ($4K), not as a minus sign. Millions read as mm to one decimal and
thousands as an uppercase K.
Forecast Grid sub-tab (8-row editing surface)
The core forecasting workspace: revenue, labor, subs, travel, materials, other direct, and computed gross profit.
Click-path:
- Click the Forecast Grid sub-tab.
- Review the Lock toolbar at the top (if in edit mode and not in sandbox):
- Each month (Jan–Dec) shows a lock icon.
- Months <=
Actuals Throughare muted (closed actuals, read-only). - Click any open month to toggle its lock state (protects from recompute).
- Above the grid, you may see:
- Prior year revenue/GP rows (if
Prior Yeartoggle is on). - The 8-row editable grid:
Revenue,Direct Labor,Subcontractors,Travel,Materials,Other Direct,Gross Profit(computed),GP %(computed).
- Prior year revenue/GP rows (if
- Click any editable cell (non-shaded, non-actual month) to enter a value.
- The grid auto-computes
Gross Profit= Revenue − (all costs). GP %auto-computes as Gross Profit / Revenue.
Key labels:
Locktoolbar — toggle month locks to prevent overwrite during recompute.- Row types:
Revenue— contract revenue for the month.Direct Labor— in-house labor cost.Subcontractors— subcontractor invoices / pass-throughs.Travel— travel costs.Materials— material / ODC costs.Other Direct— any other direct costs.Gross Profit— computed (read-only).GP %— computed margin % (read-only).
- Column headers:
JanthroughDec,Totalon right. - Cell format: currencies as numbers (no $), percentages as decimals (0.30 = 30%).
Editing workflow:
- Type a number into a cell; press Enter or Tab to confirm.
- The
Gross ProfitandGP %rows update instantly. - You'll see a
Savebutton appear in the header. - Click
Save— the backend validates closed months (rejects writes to actuals), returns a delta preview. - If the delta is large (above a nag threshold), the Rebalance Modal opens, asking if you want to adjust divisional growth targets to match.
When you click Save, the system previews the revenue delta against divisional targets. If the change is small (< $1k or < 0.1% baseline), it saves silently. If it's material, the Rebalance Modal lets you approve or adjust targets before committing.
How to know it worked:
Grid values match what you entered; totals compute correctly; gross profit and GP % update live. Save button clears after a successful save.
Quick calculators on the grid
Three small calculators sit under the grid. They are scratch pads, not sources — each one computes a shape, shows you the result, and writes nothing until you press its apply button. Nothing you type here is saved with the forecast; only the numbers you push into the grid are.
T&M Calculator — hours times a rate
For staff-augmentation work, where revenue is hours billed at a rate.
| Field | What it is |
|---|---|
| Bill Rate ($/hr) | The blended rate you bill the customer. |
| Hours/Month | Billable hours in a full month across the whole team. |
| Labor Rate ($/hr) | The blended rate you pay. The gap between this and the bill rate is the labor margin. |
| Sub Cost/Month | Subcontractor cost per month, if any. |
| ODC/Month | Other direct costs per month — travel, materials, anything billed through. |
| Months Active | How many months of the fiscal year the work runs. |
| Start Month | The fiscal month it starts in, so a mid-year start does not spread across twelve. |
Generate computes the months and shows revenue, cost and GP% on one line. Apply to Grid then writes both revenue and direct labor into the grid, month by month.
Fixed Price Calculator — revenue first, cost derived
For firm-fixed-price work, where the revenue is the deal and the cost is what you plan to spend against it.
| Field | What it is |
|---|---|
| Monthly Revenue | The monthly billing amount. |
| Target GP% | The gross profit you intend to hold. Cost is derived from this, not entered. |
| Months Active | Months of the fiscal year the work runs. |
Underneath, four percentages — labor %, subs %, travel % and materials % — split the derived cost across categories. They are a split of cost, not an addition to it, so they are meant to total 100.
The apply button here reads Apply Revenue to Grid, and it means it. Unlike the T&M calculator, it writes revenue only. The cost side stays
as it is, because a target-GP cost is a plan and not a staffing fact. If you
expected costs to land too, that is the reason they did not.
Subcontractor Costs — two ways to project
| Mode | What it does |
|---|---|
| Workable Days Avg | Projects each month from the trailing 3-month average, scaled by the number of workable days in that month. Each month's tile shows the projected cost and the day count behind it. |
| Manual | You type each month yourself. |
Workable Days Avg is the default because a flat monthly average over-forecasts short months; scaling by workable days is why December and a month with a long holiday come out lower.
Contract settings, and a button that tells you it has nothing to do
The per-contract settings panel saves with one button, and its label is the
state: it reads Save Settings when you have changed something, Saving…
while it writes, and No changes when there is nothing to save. A button
reading No changes is disabled and that is correct — it is not a failure to
register your edit, it is the panel telling you it already matches what is
stored.
Successor Contract links a contract to the award that recompeted it, and it is optional. Link it, and the old contract stops forecasting past its own end, so the recompeted work is counted once — on the new award — rather than projected by both. The contract card then names the successor program instead of a number. Choose — none — to remove the link.
Staffing Calculator sub-tab (labor-driven forecasting)
Derive and manage positions (role, bill rate, pay rate, vacancy) to auto-generate monthly labor and revenue forecasts.
Click-path:
- Click the Staffing Calculator sub-tab (only visible if your tenant has contract-allocated payroll enabled).
- Start with one of three paths:
- Add Position — manually enter role, rates, vacancy.
- Import from Pricing Proposal — pull LCATs and rates from a saved proposal.
- Derive from Actuals — back-derive rates from the last 12 months of contract revenue/actuals.
Path A: Add Position manually
- Click
Add Position. - Fill in the row:
Position Name— e.g., "Sr. Systems Engineer".Bill Rate ($/hr)— hourly rate charged to customer.Pay Rate ($/hr)— internal labor cost / hourly.Vacancy %— occupancy factor (100% = fully staffed, 80% = 20% vacancy).Escalationtoggle — enable to add a mid-year rate increase.
- If escalation is on, expand and set:
Effective Month— when the increase starts (Jan–Dec).Bill Rate Increase %— e.g., 3.0 for a 3% hike.Pay Rate Increase %— e.g., 2.5.
- The row shows computed annual estimates:
Est. Annual Revenue— Bill Rate × 160 hrs/mo × 12 mo × Vacancy %.Est. Annual DL Cost— Pay Rate × same.Margin— (Bill Rate − Pay Rate) / Bill Rate × 100 (color-coded: < 20% yellow).
- Click
Save Positionsonce you're done adding rows.
Path B: Import from Pricing Proposal
Filter the proposal list by status — it opens on All statuses, and In Review is the one most people want — pick which Period: to pull, and the preview lists each position by LCAT / Title before you commit.
Apply proposal escalation as a within-year bump is off by default and should usually stay off. Tick it only when the escalation is a rate change inside the fiscal year — an SCA wage determination taking effect on 1 October, for example. Ticking it reveals Effective month:, which is when the bump lands.
On an FFP recompete with year-over-year escalation, leave it OFF. The contract's Annual Growth % already handles option-year rates through the outyear engine, so turning this on as well applies the escalation twice.
Either way the proposal's escalation values are stored on each position, so leaving it off loses nothing — you can enable it later.
- Click
Import from Pricing Proposal. - Modal opens:
- Search for proposals by name.
- Filter by status (
WON,SUBMITTED,IN_REVIEW, or all). - Select a proposal.
- Choose the time period (e.g.,
BASE,OPTION_1, etc.) if the proposal has multiple periods. - Toggle
Apply Escalation within Yearif the proposal has mid-year rate changes you want to model. - Select
Escalation Effective Month(when rate changes fire). - Click
Import— positions are imported with LCATs, bill rates, pay rates, and proposed escalation rates pre-filled. - Adjust vacancy or escalation as needed, then
Save Positions.
Path C: Derive from Actuals
- Click
Derive from Actuals. - Modal asks: "How many FTEs are on this contract?"
- Enter an FTE count (e.g., 3).
- Click
Derive Positions. - The system analyzes the last 12 months of revenue and cost actuals, back-deriving likely position rates.
- Positions appear in the table with derived bill/pay rates.
- Adjust as needed, then
Save Positions.
Derive requires 6+ months of revenue actuals. If the contract has no actuals, you'll see an error; use Add Position or Import instead.
Monthly Forecast Preview (after saving positions)
- Once positions are saved, click
Preview Forecast. - A table appears above the positions list:
Monthly Forecast Previewheading with totals.- 12 columns (Jan–Dec) + Total.
- Rows:
Revenue,Direct Labor,Gross Profit,GP %.
- Adjust the preview:
Apply monthsdropdowns — select range (e.g., Mar to Dec).Override Revenue (FFP flat)checkbox — if on, setMonthly Revenue ($)to a fixed flat amount (for fixed-price contracts).
- Choose what to push into the main forecast grid:
Apply Revenue— only the revenue row.Apply Labor— only the direct labor row.Apply Both— both rows.
- Click the apply button → the Staffing Calculator closes, the grid is updated, and you see
Savebutton in the header.
Seat dates. A position can carry its own start and end. Use contract start fills the start from the contract rather than making you look it up, and Clear dates removes both at once. A seat with a window says so in its summary — Ends followed by the date — so a position that stops mid-year is visible without opening it. Where a position escalates, Select month... is the effective-month picker.
Returning a submitted forecast. Return to Draft opens a dialog that
requires a reason — the return control stays disabled until you type one.
The reason travels with the forecast, which is the point: whoever picks it back
up needs to know what to change.
6. Click Save in the editor header to commit the changes.
How to know it worked: After applying, the Forecast Grid shows populated revenue and direct labor columns matching the preview. Total annual revenue and DL cost should match the preview totals.
Summary sub-tab (projection visualization)
View the complete 3-year contract projection with charts and engine settings.
Click-path:
- Click the Summary sub-tab.
- Review the Forecast Engine Settings section:
- Recompete, p(win), Annual Growth, Recompete Size %, Transition Months, Vacancy Factor, Successor Contract.
- PoP (Period of Performance) range shown at the bottom.
- Below, two charts render:
- Revenue & Gross Margin by Fiscal Year — bars (revenue, left axis) and line (GM %, right axis), with reference lines for PoP end and recompete date.
- Revenue & Gross Margin by Month (Full PoP + 1 Year) — monthly breakdown with solid/faded bars (actual vs. forecast) and GM % line.
- KPI cards at the top:
Ceiling,Funded,Total Revenue (PoP+1yr),Total GP,Blended GP %,Months w/ Revenue.
Reading the charts:
- Solid bars = actual revenue (actuals through close month).
- Faded bars = forecast revenue (driven by engine settings).
- Blue line = gross margin % (right axis, 0–100%).
- Yellow dashed line = PoP end date.
- Purple dashed line = recompete date (when engine assumes the contract recompetes).
How to know it worked: Charts render smoothly; margin trends are visible; reference lines align with your contract's PoP and recompete assumptions. Outyear projections reflect Annual Growth and recompete settings.
Budget Submissions tab
Track forecast submission lifecycle: draft, submitted, approved.
Click-path:
- Click the Budget Submissions tab.
- Filter by status using buttons at the top:
ALL,DRAFT,SUBMITTED,APPROVED. - Count badge shows count per status.
- Table shows:
Contract— contract name / number.Submitted By— user who submitted.Submitteddate.Last Updateddate.Status— color-coded pill.Reviewed By— lead who approved (or empty if not yet approved).
- Click any row to open that contract's editor.
Status workflow:
DRAFT— analyst is editing; Submit button visible.SUBMITTED— awaiting lead review; leads see Approve / Return buttons.APPROVED— approved by a lead (CEO, COO, or admin role).
How to know it worked: All contract forecasts appear in the correct status bucket. Clicking a row opens the editor with the appropriate action buttons (Submit if you're the owner and it's DRAFT, Approve/Return if you're a lead and it's SUBMITTED).
Sandbox mode (testing changes without commit)
Click-path:
- In the editor header, click
Sandboxbutton. - The grid flips to a dual-view: left side shows current forecast (read-only), right side shows your sandbox edits.
- Make changes in the sandbox cells.
- Two buttons appear in the header:
Apply to Base— pushes all sandbox changes into the live forecast.Discard— abandons sandbox changes.
- Click
Apply to Baseto commit, thenSavein the header to persist to the database.
Use case: Model multiple scenarios (e.g., conservative vs. aggressive staffing) without committing each one, then choose the best and apply.
Indirect Costs tab — Inputs and Parameters
The Indirect Costs tab is where the division-level forecast gets its shape. It opens only for roles with admin-config access, and it holds two surfaces.
Inputs — how each account is forecast
Apply All pushes every account's method and value in this sub-tab through in one pass, reading Applying… while it runs. It is the only control here that writes; editing a row on its own leaves the forecast untouched.
The out-year sub-tab has its own writer, Apply Out-Year Growth, which also reads Applying… while it runs. The two apply buttons are not interchangeable — Base Year and Out-Year are two different jobs, so applying one does nothing for the other.
One row per account, with these columns:
- Account Code and Account Name — the account as your chart of accounts names it.
- Line Group — the P&L line this account rolls into, so you can see at a glance which part of the statement a method is driving.
- Semantic Role — what the platform understands this account to be, which is what lets it offer the right methods.
- Method — how the account is projected forward.
- Method Value — the number that method uses, where it takes one. A trailing average takes a period count; a manual method takes the figure itself.
- Computed Annual — what the method produces for the year, so you can sanity check a choice without leaving the screen.
Some methods are yours to choose and some are set by the system. The ones you set carry a dropdown:
- Trailing Average — project forward from recent actuals.
- Carry Forward — hold the latest actual flat.
- Zero — forecast nothing for this account.
- Manual — you supply the figure.
The rest show a read-only badge naming the method instead — Fringe (% mix), Fringe (residual), SCA Fringe (% mix), SCA Fringe (residual), Carry Forward (fixed), Budget / 12, Labor Proportional, Debt Schedule. Those accounts are derived by an engine: the fringe cascade computes fringe from the labor it sits on, labor-proportional follows direct labor, and the debt schedule comes from your instruments. There is no dropdown because a free choice on those would not be an unusual answer, it would be a wrong one.
An account showing -- select -- has no method yet and is not being
forecast. That is the row to look at when a line you expected is missing from
the projection.
Base Year and Out-Year — two sub-tabs, two different jobs
The inputs surface splits into Base Year and Out-Year.
Base Year holds Base Year Forecast Methods — how each account category is projected across the current year. The categories are Revenue, Direct Labor, Fringe, Overhead, G&A, Other Direct and Other Indirect.
Compute Preview re-reads the methods and shows you what they produce. It does not save anything — the apply control beside it is what commits, so you can look before you land it.
Out-Year holds Out-Year Growth Rates, with Save Rates to keep them and its own apply to push them through.
Parameters — the values the methods use
Each rule carries a status chip reading Active or Inactive, and the chip
is the switch — clicking it flips the rule. An Inactive rule stays on the
list with its values intact, so turning one off is not the same as deleting it
and you can turn it back on without retyping anything.
The Forecast Parameters surface is a list of named settings, each with its group, its unit, and its current value; edit one in place. Values carry their unit as you read them — a percentage, a dollar figure, or a number of days.
The groups are what the page is organized by, and each one governs a different projection:
- Bonus & Awards — the bonus budget percentage and the award-fee budget.
- Balance Sheet — the cash target, and the AR and AP day counts.
- Cash Flow — the payroll lag and the AR collection days.
Other Parameters collects anything that belongs to none of them. It appears only when there is something to put in it, so its absence means every parameter is accounted for by a group above — not that a card is missing.
Bonus Configuration is a table of rules: Label, Formula Type, Rate %, Target Account, Pool, Active and Actions. With none configured it says so and offers to add one; if the rules could not be loaded it says that instead and offers Retry, because the two mean opposite things.
Saving adds rules, it does not replace them. Rules you save are written alongside any already on file, so wait for the panel to load before adding any — rules entered while it cannot read the current set can leave you with the same rule twice, and these rules drive indirect forecasting.
Formula Type is the choice that decides what the rate is a percentage of:
| Type | The rate applies to |
|---|---|
| % New Award GP | gross profit on new awards only |
| % Gross Profit | gross profit overall |
| % Revenue | revenue |
| Fixed Amount | nothing — the value is the amount itself, and the rate is not used |
The first two are the pair to be careful with. They sit next to each other, differ by two words, and produce very different accruals on a book with a lot of existing work — one accrues on this year's wins, the other on everything.
Change a parameter only when you know which method reads it. The methods above consume these values, so a parameter edit moves every account forecast by that method — which is the point of keeping them here rather than on each account, and also the reason a casual edit reaches further than it looks.
When a panel cannot load
An empty panel and a failed panel mean opposite things, and the forecast screens keep them apart.
A panel whose data never arrived says so, and offers Retry. You will see this on the Pipeline Forecast portfolio, the Contract Forecasts list, the Budget Submissions list, the proposal picker behind Import from Pricing Proposal, the Subcontractor Costs panel, the Growth Targets tab, the Monthly New Business Forecast grid, the Forecast Parameters page and Bonus Configuration. Retry re-runs only that panel's request. Nothing you have entered elsewhere on the screen is affected.
An empty state is a statement about your book, not about the request. No submissions means the request came back and there was nothing in it — nobody
has submitted a budget under that filter. No contracts found means your
search matched nothing. Those are facts to act on.
The distinction is worth knowing because the two remedies are opposite: a
panel that failed is retried, an empty one is filled. A screen that answered
a dropped request with No submissions would be telling you something about
the business that it had never managed to ask.
Common workflows
Forecast a new contract (T&M staff-augmentation model)
- Navigate to the contract forecast; open the editor.
- Open the Staffing Calculator sub-tab.
- Click
Derive from Actuals(if available) orAdd Positionto build positions. - Enter Bill Rate, Pay Rate, Vacancy %; add escalation if applicable.
Save Positions, thenPreview Forecast.- Adjust
Apply monthsrange to match the contract's PoP. - Click
Apply Bothto push revenue and labor into the grid. - Review the Summary tab to verify margin trends.
- Adjust individual months in the Forecast Grid if needed (e.g., ramp-down at PoP end).
Savethe grid.- When satisfied, click
Submitin the editor header. - (Lead reviews and clicks
ApproveorReturn.)
Forecast a fixed-price (FFP) contract
- Open the contract; go to Staffing Calculator.
- Add positions as above, or import from the pricing proposal.
Save Positions, thenPreview Forecast.- Toggle
Override Revenue (FFP flat). - Set
Monthly Revenue ($)to the negotiated monthly amount (e.g., $250K / 12 months). Apply Revenue(leave labor in the grid for tracking).Savethe grid.- Use the Summary tab to verify margins track the pricing model.
Lock forecast months to prevent recompute overwrite
- In the Forecast Grid sub-tab, find the Lock toolbar.
- Click any open month (after
Actuals Through); it turns teal with a lock icon. - That month is now protected: if a recompute is triggered, it won't overwrite locked months.
- Unlock by clicking again (or lock all for maximum stability).
Return a forecast for revision (lead workflow)
- Go to the Budget Submissions tab and filter by
SUBMITTED. - Click the contract row to open the editor.
- Click
Returnbutton (red/yellow, lead role only). - Enter a reason (e.g., "Margins below 15%; reforecast with 2 more staff").
- Status flips back to
DRAFTand the original analyst sees the return reason in the editor. - Analyst revises and re-submits.
Related
Forecast Cockpit — company-wide dial tuning for financial statements (separate module; reaches the same /api/cockpit endpoints but operates at portfolio level, not contract level).
Pricing Module — create and manage proposals; Staffing Calculator can import positions from saved proposals.
Treasury — 13-week cash forecast (separate engine; not affected by Forecast edits).
Financial Statements — three-statement projections built from contract forecasts (driven by cockpit dials and contract-level data combined).