Pricing Module
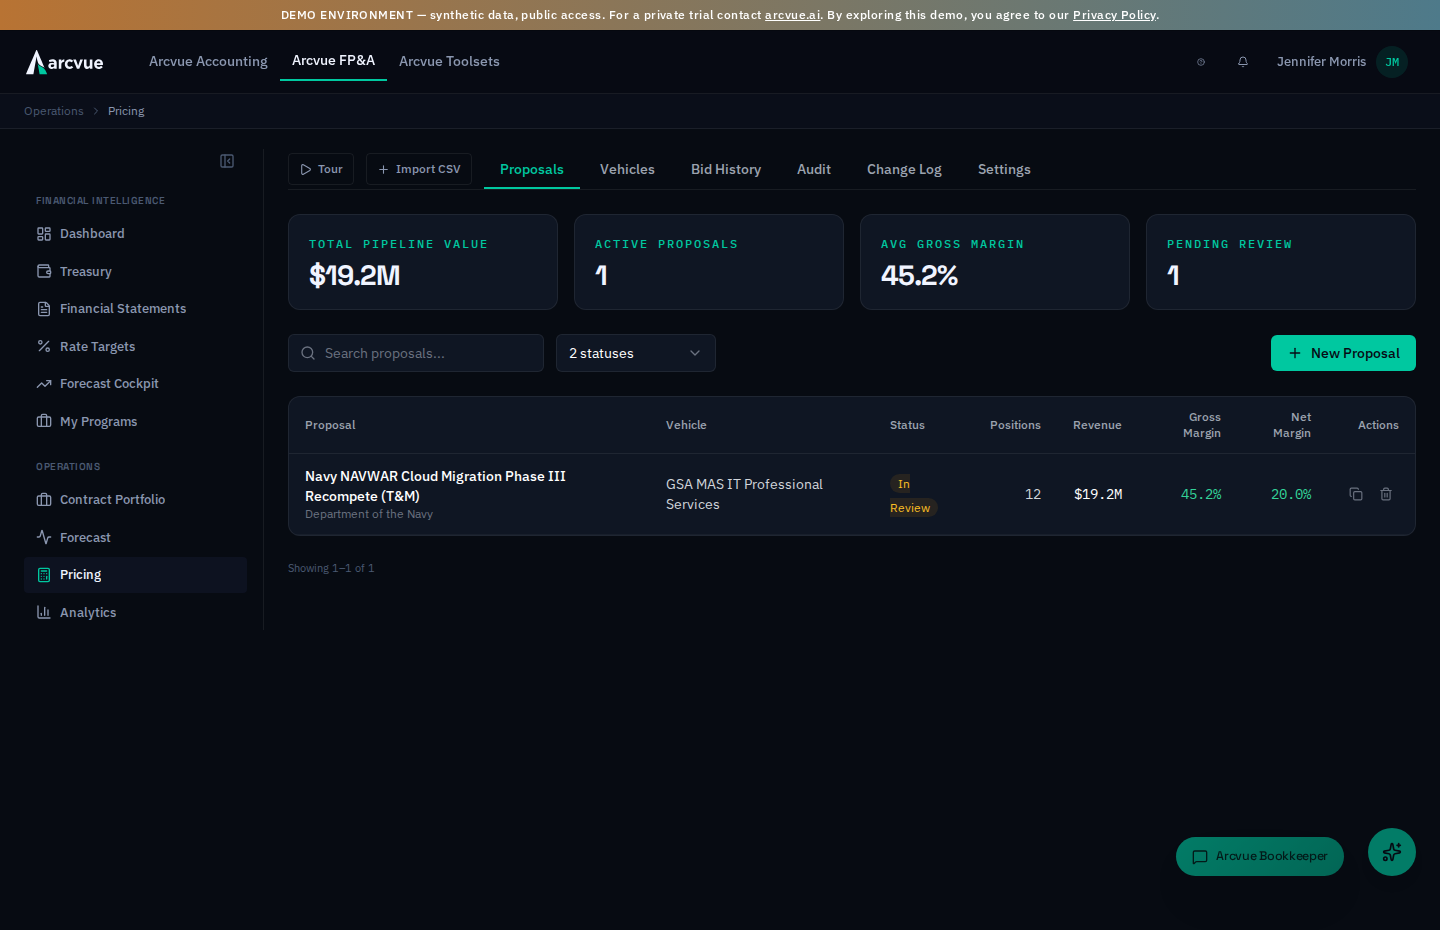
Proposal pricing and wrap-rate management for competitive bid development, margin tuning, and market validation across multiple contract vehicle types and procurement structures.
Overview
The Pricing module is your workspace for developing, validating, and submitting government proposals. It organizes pricing work into five sequential stages—Build, Price, Validate, Compare, and Submit—each with specialized tabs and calculations. You move between them with the advance control in the workspace header, which names its destination — Advance to Validate →, Advance to Compare →, Advance to Submit →. You can create unlimited proposals per vehicle type, track bid history, and benchmark your positions against market rates. All revenue, cost, margin, and escalation computations cascade automatically as you build out labor positions, subcontractor markups, and other direct costs.
How to Open Pricing
In the left nav, open FP&A → Operations → Pricing.
The module defaults to the Proposals tab. You will see:
- Four KPI cards: Total Pipeline Value, Active Proposals, Avg Gross Margin, Pending Review. These are computed across every proposal in the tenant, not just the ones currently listed below, so narrowing the search or status filter does not move them.
- A search bar labeled
Search proposals... - A status filter which reads
2 statusesby default, because Draft and In Review are both selected. Selecting exactly one shows that status's name; clearing it showsAll Statuses. Use Clear (show all) inside the dropdown to see every proposal regardless of status — including Won, Lost and No Bid, which the default view hides. - A New Proposal button
- Beneath the table, a line reading
Showing 1–25 of 29(and, when a search or status filter is narrowing the list,Showing 1–7 of 7 matching (29 total)). When there is more than one page, Previous / Next controls appear beside it.
The list shows 25 rows per page. The count line and pager exist so that a proposal further down the list is always reachable and never silently absent — if the number after "of" is larger than the rows on screen, there is another page. If a proposal seems to be missing, clear the status filter first: the default view hides Won, Lost and No Bid.
At the top, three utility buttons are always visible:
- Tour — replay the guided setup walkthrough
- + Import CSV — bulk-add labor positions from a spreadsheet
- Main tabs: Proposals, Support / Informal, Vehicles, Bid History, Audit, Change Log — plus a Settings tab (for users with admin/CEO/CFO/finance-lead/operations-lead access) that hosts the DCAA provisional rate card relocated from the Admin console
Proposals that are not linked to a NEO pursuit
A pricing proposal and the NEO pursuit it was priced for are two records. Linking them is what lets a deal be followed end to end — the opportunity, the price you built, and eventually the contract. Until now the only way to tell whether a proposal was linked was to open it, which meant an unlinked one could sit there indefinitely without anyone noticing.
Two things on the Proposals tab make that visible:
- An amber No NEO pursuit chip under the proposal name on any row with no pursuit behind it. A row with no chip is linked.
- Above the table, a line reading, for example, 23 of 44 proposals have no NEO pursuit behind them. We can name the pursuit for 8. This counts every proposal in the tenant that can still be linked, not just the ones on screen, so narrowing the search or status filter does not move it. Canceled and no-bid proposals are left out, because nothing will ever match them and counting them would make a to-do that cannot reach zero.
On a tenant that does not use NEO, no row is badged and the line above the table does not appear. That is correct: without NEO there is no pursuit to link to, and flagging every proposal would be noise rather than a finding.
Review links
Review links, beside that line, opens a panel headed Deal links that lists everything a deal is not yet connected to, in one place. The panel restates the count under its heading, and Close — or the Escape key — dismisses it without changing anything; nothing in it is saved until you link a row.
Matched to a pursuit are the ones where we can name the pursuit. Each row shows the proposal on the left and the pursuit we found on the right, with both solicitation numbers side by side. Read those two numbers before you act — they are the whole point of the row. A pursuit whose number differs from the proposal's is called out in amber, because the same procurement is sometimes captured in NEO more than once and the match may be pointing at the wrong copy of it. Where NEO already points back at the proposal, the row says so; that is a stronger statement than a number match, because it is the system's own record of the link rather than an inference from the numbering.
Link on a row carries out the link. There is deliberately no link everything action: the matching is right most of the time and not all of the time, and one wrong link made in bulk is harder to find than five made one at a time. Confirm them individually.
No pursuit found lists proposals where nothing in your NEO opportunity library, active or not, matches the solicitation number. These are not a failure to link — they are usually work priced for a pursuit that was never captured in NEO, and they are listed so you can see they have been accounted for rather than missed. If the pursuit does exist under a different number, open the proposal and link it by hand from the workspace header.
Won, and not yet tied to a contract
The panel's last section is the other end of the same question. A pricing proposal and the contract it became are two records, and joining them is what lets one deal be followed from the opportunity, through the price you built, to the work you are now delivering.
This list is short by nature and that is not a shortfall. A proposal only reaches the Contracts Portfolio if it was bid, won and staffed, so most won proposals will never appear here — there is no contract yet to point at.
Each row shows the proposal and its solicitation number on the left, the
contract and its award number on the right, and the stem the match was made
on. Read those two numbers before you press Link: a solicitation number is
not an award number. The number you bid under is replaced when the award is
issued, so 140P2026Q0006 becomes 140P2026F0087 — same issuing office, same
fiscal year, different document. That shared stem is the whole basis of the
match, which is why the row tells you what it is rather than asking you to take
the pairing on trust.
Linking writes the deal's identifier onto the contract. Nothing else about the contract changes, and nothing about your books moves.
When we cannot match a won proposal to a contract, name it yourself: Link contract on the row opens a search (Search contracts by name or number...), and choosing the contract the proposal became carries the deal's identifier onto it, exactly as a matched link does.
The link is stored in two places — on the proposal and on the pursuit — and a proposal that reached a Won or Lost outcome used to get only the pursuit's half written. Those show up here as NEO already points to this proposal. Linking them writes the missing half; nothing else about the deal changes.
The Support / Informal tab
The tab opens with an explanation panel — its accessible name is What support and informal pricing is — rather than a set of KPI cards. That is deliberate: a large figure in a card reads as a company total no matter what its label says, and this tab exists precisely to keep prices that are not yours out of your own numbers.
Sometimes you price a pursuit that is not yours to win — a prime asks you to build its bid, or you run a what-if that never goes out. That work is worth keeping for the rate history and precedent it carries, but the dollars are not your company's, so counting them would overstate the pipeline.
Set Price Type to Support / Informal on the proposal and it moves to this tab, under the heading Priced here, but not ours to win, with a Kept out of line naming exactly what it is excluded from — Pipeline value · Win rate · Won-business revenue — and a count of how many proposals sit there. From there it is kept out of Total Pipeline Value, the win-rate tiles and breakdowns, and the won-business revenue that feeds your new-business forecast. Nothing is deleted and nothing is hidden — the proposal opens and edits exactly as any other, and its workspace header carries a Support / Informal badge so the classification is visible while you work.
The Staffing tab
A recruiter or an operations lead usually starts from the other end of the pricing arithmetic: they have a bill rate on a contract and need to know what they can offer a candidate. This tab runs the wrap backwards.
Enter the Bill rate and the matrix appears. It is the same fringe, overhead and G&A the rest of Pricing uses, so a salary that looks affordable here is the salary a pricer would reach from the other direction.
The middle row is the answer. It carries an On target badge and is the highest salary that still hits the company's gross margin target. Rows step up and down from it by the Salary step amount, so the matrix shows what each increment costs in margin.
Several positions at once
Most hiring decisions are not about one seat. Add Position gives you another matrix under the first, with its own bill rate, step, hours and SCA setting, and each one is named — type over Position 1 to call it what the requisition calls it.
Collapse a position and its header still carries the answer: the bill rate, the most you can offer, and the gross margin at that salary, colored. So a set of six roles reads as six lines you can take into a conversation, and the matrix behind any of them is one click away when somebody wants to argue with it. Collapse all does the whole set at once, and reads Expand all once everything is collapsed.
Saving a set
Type a Set name and press Save set. It appears under Saved sets with its position count and the date it was last saved; Open loads it back, and a loaded set opens collapsed, because a saved set is read as its answers first.
Two things worth knowing before you rely on it:
- Saving under a name that already exists REPLACES that set. It does not make a second copy. That is deliberate — a list of Q4 recruiting, Q4 recruiting (2) and Q4 recruiting (3) is a list nobody can choose from. Use a new name when you mean a new set.
- A set stores the bill rates you entered, not the salaries it worked out. Opening one next quarter runs the current rates over the same positions, so it shows what is true now. A stored salary would be a number that quietly stopped being true the day the indirect rates moved, and it would look exactly as authoritative as a correct one.
Saved sets are visible to everyone who can open Pricing, not just the person who saved them — recruiters and their lead work from the same sets. The name of whoever saved it is kept so you know who to ask about a set you did not build.
Three more controls shape each position:
- Salary step — the gap between rows. $5,000 by default.
- Productive hours per year — 1,920 by default. This scales the annual columns and moves no margin at all. Revenue and pay are both a rate times hours, so the hours cancel out of every ratio. Salary is always divided by 2,080 regardless of what you put here.
- Service Contract Act position — uses the SCA fringe rate instead of the non-SCA one. It changes the net margin and the annual cost; it does not change gross margin, which is labor-only by definition.
Reading the matrix
| Column | What it is |
|---|---|
| Salary | The annual salary being tested. |
| Pay rate | That salary divided by 2,080 paid hours. |
| Gross margin | Revenue less pay, before any indirect. This is the only colored column. |
| After fringe | Gross margin once the fringe pool is applied. |
| Net margin | Margin after the whole fringe, overhead and G&A wrap. |
| Annual cost | Fully burdened annual cost at the productive hours entered. |
Only gross margin carries a color, and that is deliberate. Green is at or above the target, amber is within the band below it, red is past that. Net margin is shown because the consequence of the indirect rates is worth seeing, but it is never colored: the wrap is not a bidder's to move, and a red cell would blame them for it.
The line under the matrix says where the target came from — either that a finance lead set it in Pricing > Settings, or that it was derived from the company's own trailing twelve closed months plus one point, naming the margin and the number of months it read. If no rates are configured, or there are no closed months to derive a target from, the tab says so and names the screen to go to rather than showing a matrix built on nothing.
The Settings tab (admin-config roles)
If your role can manage configuration (admin, CEO, CFO, finance-lead, or operations-lead), a sixth Settings tab appears. It hosts the tenant-wide DCAA provisional rate card — fiscal year, Fringe (Non-SCA and SCA), Overhead, G&A, Material Handling, H&W ($/hr), and the rate basis. These are the rates a proposal's Pull from Pricing Rate Settings button pulls in.
It also carries Target gross margin (%), which is the threshold every margin color in Pricing reads — the proposal lists, the audit list and the Staffing matrix all band against this one number rather than against constants typed into each screen. The rate list shows it in the Target GM column.
Leave it blank and it tracks the business: the target becomes the company's own gross margin over the trailing twelve closed months, plus one point. That is the recommended state, because a number typed once goes stale while the books do not. Enter a percentage to override it; clear the box to hand it back.
If you move PoP Start or a period length later: "The schedule year moved"
Moving PoP Start can push periods into a different published schedule year. When that happens the workspace stops and says so, naming the years affected — because it has done half the work and deliberately not the other half.
- Ceiling rates have already been recomputed from the schedule at the new years.
- Option-year salaries have not. They still step on the old year boundaries.
That leaves cost and revenue escalating on two different schedules, and the margin on every affected period reads wrong — not blank, not flagged in the grid, just quietly incorrect. The dialog is the only place it is stated.
Two choices:
- Re-apply escalation — re-flows option-year salaries from the base year using the proposal defaults and any per-period overrides, and reports how many option-year positions it moved. It overwrites manual option-year salary edits, which is exactly why it is not automatic — if someone hand-set an option-year salary, this replaces it.
- Leave salaries as they are — dismisses the notice and accepts the mismatch. Reasonable only if you intend to correct the salaries yourself; it does not fix anything.
Reading the card
The card is headed Approved Indirect Rates, and each row is one fiscal year. Fiscal Year and Rate Basis say which year the rates apply to and where they came from. Rate Basis takes the value it is shown as on screen — Prior Year Actuals, YTD Actuals, an estimate, or Provisional Submitted to DCAA — and the Basis column carries it in the compact view, beside Year, with Action holding Edit (and Cancel while you are in a row). The pools follow: Fringe Non-SCA (%) and Fringe SCA (%) (shown as Fringe Non-SCA and Fringe SCA), Overhead (%) (grouped on screen under Overhead pool rates), G&A (%), M&H, and H&W ($/hr) as a dollar rate rather than a percentage. Notes is where you record why a year's rates are what they are, which is the field that saves an argument a year later.
Rate Basis is the column to check first when a proposal prices oddly. A card still on an estimate when your provisional submission has gone in will price every pull from it against the wrong basis, and nothing on the proposal says so.
Set Material Handling even if most of your work is labor — it is the pool that applies to subcontractor and material dollars, so leaving it at zero here means every proposal that pulls these rates prices subcontracts with no M&H recovery at all. Nothing warns you, because a labor-only bid looks identical either way. This card previously lived in the Admin console; it now lives here on the Pricing page.
Creating a New Proposal
- Click the New Proposal button.
- Fill in the required fields:
The form marks most of what it requires with an asterisk:
Proposal Name *,Company Name *,Contract Type *,Price Type *,Set-Aside *andPoP Start *here, plusRole *on the position form andSIN *on the schedule form. Vehicle is required too and carries no asterisk — the form tells you when you try to create. It will not submit until each is set.- Proposal Name — internal label (e.g., "DoD IT Services FY26")
- Contract Type — from dropdown (FFP, T&M, CPFF, etc.)
- Role — Prime or Subcontractor
- Price Type — Company Bid (the default, and what almost every proposal is) or Support / Informal. Choose Support / Informal only when the price is not yours to realize — you are building it for another firm to submit, or it is an exercise that will not go out. This is a different question from Role: a subcontract bid is revenue you fully realize and stays a Company Bid; Price Type asks whether the money is yours at all
- Set-Aside — from the dropdown (Full and Open, 8(a), HUBZone, etc.)
- Vehicle — the contract vehicle the bid is priced against. Required, even though the label carries no asterisk: a proposal cannot exist without one, and the vehicle is what supplies the ceiling rates. Picking it also resolves the default escalation rate from that vehicle's own schedule.
- Division — optional, chosen from the divisions configured for your company; the dropdown reads Select division until you pick one.
- PoP Start — the period-of-performance start date. Required since 2026-07-30: it resolves each period to a published schedule year, and that year selects the ceiling rate a position is allowed to bill. Create stays disabled until you set it. You can still correct it later via Edit Details — it is required, not locked. Correcting it after periods exist has a consequence worth knowing — see below.
- Optional fields include:
- Solicitation # — RFQ or RFPS reference
- Agency — start typing to search (e.g., Navy, DOJ, USDA)
- Customer / Sub-Agency — subordinate office (e.g., NMCFHPC, APHIS)
- Contracting Office — issuing location
- NAICS Code — 6-digit code (prefilled if primary is set)
- PoP End — period-of-performance end date. Optional, and normally derived from PoP Start plus the base period and option years (PoP Start itself is required — see above)
- Base Period (months) — how many months is the base contract?
- Option Years — number of option years. Once this is above zero a line appears reading All option years: 12 months · Set per-year lengths. That line is a button, not a status. It is styled as underlined text, so it reads as a statement of fact about the proposal — but it is the only way to price an option year that is not twelve months. Click it and it is replaced by one month box per option year (OY1, OY2, …). If any option period on your solicitation runs short or long, you have to click here; nothing else on the form offers it, and leaving it alone prices every option year at twelve months.
- Default Escalation Rate (%) — percentage applied annually to salaries and rates in Option Years
- Standard Work Hrs / Yr per Person — default 1920 (8 hrs × 5 days × 48 wk); used when you don't specify hours per position
- Notes — any free-text context
- Click Create to save.
The proposal enters Draft status and you are taken to the workspace.
If you know you'll adjust indirect rates (fringe, overhead, G&A, fee, make-good hours) later, enter your best-guess defaults here. You can revise them anytime via Edit Details in the workspace header.
Edit Proposal Details
Nothing on this panel saves as you type. Save Changes writes the whole panel and reads Saving… while it works; Cancel discards it.
Edit Details in the workspace header opens Edit Proposal Details — the business metadata you set at creation, plus the period structure. **Solicitation
(RFP/RFQ)**, Proposal Name, Contract Type and the rest are editable
here; so is PoP Start, with the consequence described above.
Period Lengths sets Base Period (months) and Option Period (months), each a whole number from 1 to 60. A base often runs 13 months to cover a transition month while the option years run 12. Changing a length moves no position: hours that were filled in automatically re-derive for the new length, and hours you typed stay as typed. A base length change also moves where every later period starts, so it can shift a period into a different published schedule year exactly as a PoP Start change can. When the option years were given different lengths at creation, Option Periods (months) lists them instead and they cannot be changed here. The number of option years is not editable; clone the proposal to change it.
Changing the vehicle is only possible while the proposal is in Draft. In Draft the Vehicle field is a dropdown that re-snapshots the rates onto the new vehicle. Positions whose labor category has no match on the new vehicle are cleared, and the screen tells you how many need a new LCAT — re-select them before you read any margin. Once the proposal leaves Draft the field is replaced by a line saying the vehicle is locked, and the way to change it is to clone the proposal.
A proposal must have a vehicle. The dropdown lists No Vehicle first, but it is not a way to detach one — this control changes the vehicle, it does not remove it.
Include FAR 52.217-8 extension adds an EXT8 period priced at last-option-year rates, with hours scaled to the months you give it. Ticking it reveals Extension months:, which accepts 1 to 12 and defaults to 6 — the six months is the default, not the rule.
Warranty reserve (%) holds the rate and Warranty basis says what the rate is taken on. Burdened cost (the default) applies it to material, freight, M&H and G&A. Price applies it to the buildup price the line will carry; that price includes the reserve, so the engine solves for it rather than iterating, and a rate of 100% or more is refused because no price satisfies it. The fee is never applied to the reserve under either basis.
Rework labor decides whether rework hours improve with the learning curve. Flat per reworked unit (the default) keeps them outside the curve, because a repair is unplanned corrective work whose incidence the rework rate already carries. Follows the planned operation's learning curve applies the operation's own slope and lot position to the rework hours, a follow-on lot's prior quantity included. A component with no planned hours or no curve reads the same under both. No screen enters a component's rework rate or hours, so on a bid built on these screens the election has nothing to act on.
Both elections default to the arithmetic every earlier proposal was priced on, so a submitted proposal does not move when they appear.
Five-Stage Pricing Workflow
Once you open a proposal, the left rail shows five stages. Each is a clickable rail item with a descriptive summary below it:
- Build — Add labor positions, subcontractors, other direct costs; generate period structure (base + option years)
- Price — Tune wrap rates (fringe, overhead, G&A, fee), margin targets, period-by-period escalation
- Validate — Run market-rate benchmarks against CALC+ data; check vehicle compliance caps
- Compare — Competitive positioning; what-if scenarios; price-to-win analysis
- Submit — Audit checklist, version snapshots, final submission sign-off
Stage progression is monotonic: you can revisit any completed stage at any time, but cannot skip ahead. To advance to the next stage, click the Advance to [Next] → button pinned to the bottom of the left rail.
A proposal cannot advance from Build to Price until you have added at least one position with a salary or hourly rate. Similarly, readonly proposals (Submitted, Won, Lost, In Review, Canceled, No Bid, DQ) cannot be edited; you must clone or create a new version instead.
Stage 1: Build
Tab: Positions
This is where you define labor headcount and hourly positions.
- Click + Add Position to open the position drawer.
- Fill in:
- LCAT / Position — labor category (autocompletes from your prior entries)
- Pay Type — S (Salary) or H (Hourly)
- # People — decimal OK for part-time (0.5 = half-time)
- Salary/Rate — annual salary or hourly rate
- Ceiling — GSA max (if using a GSA vehicle) or user-entered Bill Rate
- Disc % — discount from ceiling (0–100%)
- Hrs/Person — annual work hours per person (default 1920, capped at 2080 to prevent entry errors)
- SCA Classification — (optional) Service Contract Act class for prevailing-wage compliance
- Click Save Position to add to the proposal.
What the position drawer derives for you
Three fields are read-only and calculated as you type. They are worth watching, because they are what the engine actually prices.
- Base-year escalation % — ages today's salary to the base year. It defaults to 0, and 0 means the base year is priced at today's rate. Below it, Base year salary (derived) — or Base year hourly rate (derived) on an hourly position — shows the result and is labeled used by the pricing engine. That is the number in the bid; the salary you typed is the input to it.
- Productive hours / year (derived) — people × productive hours per person, with the arithmetic spelled out underneath.
- Live Preview — the running cost of the position as entered: Hourly Rate, Comp Cost, Ceiling Rate, Ext Rate (after disc), Est Revenue and Implied Wrap. The wrap shows green in the 2.0–3.5 band and amber outside it, which is a prompt to look rather than a rule.
Override bill hours (T&M with non-standard billing) is the one place these come apart on purpose: revenue then uses rate × the bill hours you enter, while cost still uses the productive hours above. That is the point of the override — it is not a discrepancy to reconcile.
The grid shows LCAT, Pay Type, # People, Salary/Rate, Ceiling (or Bill Rate), Disc %, Ext Rate, Hrs/Person, and a Flag column, then the computed columns Total Cost, Total Price, Gross Margin, Contribution, Net Margin and Wrap:
- OT = overtime line (1.5× rate; separate CLIN)
- 🕒 = part-time (less than 90% full-time)
- ⚠ = per-person hours exceed 2080/yr
- Blank = coherent
To edit a position, click its row. To delete, click the × button.
Each position can show its cost trace — a step-by-step table of how its number was reached: Step, Formula, Inputs and Value, one row per stage of the buildup. This is where you settle an argument about a figure rather than re-deriving it by hand. Panels like this one fetch on demand, so a failed load shows a Retry control rather than an empty table — an empty table and a failed fetch are different things, and the control is how you tell them apart.
View modes at the top right:
-
Grid — tabular layout (default)
-
Tuning — a margin grid you can edit in place, with the per-period escalation editor beneath it.
- Grid columns: the Flag column, Comp $ (annual salary, editable), Ceiling or Bill Rate, Disc% (editable), Ext Rate, Revenue, Cost, GP%, CM%, NP% and Wrap. When you have loaded market benchmarks, two more appear: Mkt Med and vs Mkt — where the extended rate sits against the market median, as a percentage. Their absence means no benchmarks are loaded, not that the position is at market.
- An em dash in a margin or Wrap cell means the figure is not known. It does not mean zero. A position the engine has not priced yet carries no net margin, and a row carrying no cost has no absorbed margin to show -- those cells read as a dash. Only a cell showing 0.0% is claiming a genuine breakeven, and only a Wrap showing a number is claiming a real wrap rate. That distinction is the whole reason for the dash: a gap you can go and chase is worth more to you than a confident figure nobody computed. If a margin you expect to see reads as a dash, the position has not been costed yet rather than costed at nothing.
- Which of Ceiling / Bill Rate you see is decided by the vehicle, and so is whether you can type in it: an Open Market vehicle shows Bill Rate and lets you edit it, every other vehicle type shows Ceiling read-only, because the ceiling belongs to the vehicle rather than to this proposal.
- Escalation editor columns are Period, Salary %, Price % and
Source.
Sourceis how you tell a proposal default from a per-period override — the Annual Escalation panel says overrides win, and this column is where you see which one a given period is actually on.
warningEditing
Comp $in the grid clears that position's salary audit trail. Hover the cell and it normally tells you where the number came from — Today $X × (1 + Y%) = $Z. Type over it and the tooltip changes to say the audit trail was not captured. The value is correct either way; what you lose is the record of how it was derived. To change a salary and keep the provenance, open the position and set today's salary and the base-year escalation there instead. -
Matrix — side-by-side period comparison, with Position, LCAT, SCA, the pay-type rate, Rev, NM% and Total Rev. This is the margin read across periods, which is a different question from the three margins on a single position above.
Editing many positions at once
Select positions in the grid and the bulk bar acts on all of them in the period you are viewing — the confirmation names the count and the period before anything changes. Four operations:
| Operation | Unit | What it does |
|---|---|---|
| Set discount to | % | Replaces each selected position's discount outright. |
| Change discount by | pts | Moves each one relative to where it already is. |
| Change salary by | % | Moves each salary relative to its current value. |
| Set headcount to | people | Replaces # of Personnel on each. |
Set … to and Change … by are one word apart and they are not the same operation. On a position already discounted 10%, Set discount to 5 leaves it at 5%, and Change discount by 5 leaves it at 15% — a three-fold difference in the direction that loses money. The units are the tell: % is absolute, pts is relative.
There is also an Adjust all discounts by: control that applies across the board rather than to a selection, and Apply Rate Adjustment for pushing an indirect-rate change through the proposal.
Escalation — the four controls that decide whether rates move
Escalation ages salaries and rates through the option years. Four controls govern it and they are easy to confuse, because three of them write and one of them only looks like it does.
| Control | What it does |
|---|---|
| Save & Recompute | One combined action — it stores the per-period overrides and recomputes the proposal. Quick-fill overwrites every option-year input on screen and saves nothing until you press this. |
| Re-apply Escalation | Re-cascades salaries, and bill rates on non-ceiling vehicles, to every option-year position using the current proposal default and per-period rates. |
| Lock Flat | Zeros all escalation, price and labor, across every period, overriding every per-period and per-position entry. |
| Unlock | Re-enables escalation. Your stored values are not changed — the default and any overrides simply resume being applied. |
Lock Flat is the SCA-style bid, and it is a deliberate choice rather
than a shortcut. Those bids typically ask for an equitable price
adjustment each year against the revised wage determination instead of
carrying a built-in escalation rate. The confirmation asks Lock escalation at
0%? before anything changes.
The chip beside the table is the state: it reads Escalation: Lock Flat while escalation is live, and Escalation: FLAT (locked) once it is not. When it is locked the whole table dims and every input disables.
After you save rates, Arcvue asks about the salaries you typed by hand
Saving new rates does not by itself move option-year salaries that somebody entered manually. When that would change figures you typed, a prompt offers two outcomes and both are real choices, not a confirmation:
- Re-flow salaries re-derives the option years from the base year and replaces the hand-entered figures, reading Re-flowing... while it runs.
- Leave salaries as they are keeps them, and the rates you just saved will not reach those positions until escalation is re-applied from the header.
Tab: Subcontractors
Add pass-through subcontractor costs and their associated markups (M&H, G&A, fee).
Each subcontractor line is entered one of two ways, and the choice decides what you have to supply:
- Lump Sum — one cost for the sub's whole scope. Use it when the teaming agreement prices the work as a package and you are not pricing their people individually.
- By Position — the sub's labor built up position by position, the way your own is. Use it when you need their staffing visible — it is what lets the Labor Workshare split below be read per position rather than as a single block.
These two are the standard pair; the list is supplied by the platform, so a tenant may see more.
The choice is not only presentational. A lump-sum line contributes its whole cost to workshare with no internal detail, so a proposal built entirely of lump-sum subs can satisfy a workshare target without anyone being able to see which positions produced it.
- Click + Add Sub. The panel is headed Add Subcontractor.
- Enter:
- Subcontractor — name or abbreviation
- Sub Type — what kind of subcontract this is
- Role / Position — the labor category they are filling, if applicable
- Sub Cost (annual $) — an annual figure, not the contract total. The field says so; enter one year's cost and let the periods multiply it.
- Sub Fee Rate (%) — the subcontractor's own fee, which the field labels as separate from your proposal fee rate
- M&H (%), G&A % — leave M&H (%) blank to inherit the proposal default; vehicle pass-through caps still apply
- Cost type — Recurring or Non-recurring. This is not a reporting label: it decides whether the seat is priced in the option years. A non-recurring seat, such as a transition-in team, is priced once; a seat left Not classified rolls into every option period when option pricing is generated, so the total comes in above the schedule you meant to submit.
- Click Save.
Two fields here are easy to read as something they are not.
Sub Cost is annual. On a base year plus four options, entering the whole contract value prices the subcontract five times over.
Sub Fee Rate is the sub's fee, not yours. It is what they charge you, and the screen states that explicitly because the two fees are separate numbers that both end up in the same total. Your proposal fee is set at the proposal level.
The grid shows the sub name and cost with the applied markups as their own columns — M&H %, Sub Fee % — its Cost type, and the resulting total revenue. You can edit or delete inline until the proposal is submitted, won or lost; from then on the Subcontractor and Other Direct Costs lines are read-only on this screen, as the positions and deliverables already are.
Labor Workshare
Beneath the subcontractor lines, the prime/sub split by period and in total: Party, a column per period, Total, Share, Target and Variance. Your own row is the bold one. Until there are priced positions and subcontractor lines it shows an explanation instead of a table.
Workshare here is measured on labor only — other direct costs are excluded, as they are from most teaming agreements. If your agreement states its workshare on a different base, this Share is not the number that agreement is talking about.
Target is the split you are aiming for and Variance is how far the current build sits from it, so the row to read is the one whose variance is moving in the wrong direction as you add positions.
Tab: Other Direct Costs
ODCs are non-labor, non-sub expenses (travel, software licenses, hardware, etc.).
- Click + Add ODC.
- Enter:
- Category — Travel, Material, or Other (ODC)
- Description — (e.g., "Cloud subscriptions")
- CLIN — the contract line item this cost belongs to. Use the NRE CLIN for tooling, special test equipment and qualification testing; the production CLIN for freight and warranty. It prints in the CLIN column of the ODC sheet, and an evaluator matches the cost volume to the solicitation on it.
- Cost type — Recurring - repeats with production or Non-recurring - charged once. The labels carry the test: recurring means it scales with what you build, which is why freight is recurring and tooling is not. FAR 15.408 Table 15-2 reports the two separately, and an unclassified ODC is reported in its own column rather than counted as recurring — so the NRC line is understated by whatever part of it was non-recurring. Tooling, special test equipment and qualification testing are non-recurring.
- Amortize over (units) — only when the proposal's non-recurring treatment is Amortized: the number of units this one-time cost is spread across. Blank charges it as a lump, which is the only behavior under the Separate CLIN treatment.
- Quantity and Unit Cost ($) — the direct cost
- Applicable Periods — one row is created per period you tick
- Click Save.
Whether G&A and fee apply to an ODC is a proposal-level setting under Rate Application, not a per-line markup field. The grid shows period, CLIN, description, category, cost type, quantity, unit cost and total; edit any of them inline, or delete the row, until the proposal is submitted, won or lost.
Tab: Deliverables
Two editors, and each one tells you which mode it is in by its own label.
| You are | The dialog is headed | The button reads |
|---|---|---|
| adding a component | — | Add component |
| editing one | — | Save component |
| adding a deliverable line | Add deliverable line | — |
| editing one | Edit deliverable line | — |
So the heading and the button are the state indicator. If the component editor's button reads Save component, you opened an existing component rather than starting a new one, and saving will overwrite it.
For the things a bid sells rather than the people it staffs: hardware, software, licenses, subscriptions, kits -- any item with a price the customer is quoted and a cost you pay, stated separately. A services bid leaves this tab empty.
The table shows each line in two column groups, Price and Cost, with the margin between them:
| Column | What it holds |
|---|---|
| Period | The proposal period the line is priced in |
| Line | The description, with manufacturer, part number and unit of measure beneath it |
| Qty | Units sold in the period |
| Unit price / Extended | What the customer is quoted per unit (List price ($) less Discount (%) when that is the basis), and unit price x quantity (x months on a recurring line) |
| Unit cost / Burdened | What a unit costs you, and direct cost plus material handling and G&A at the proposal's rates -- computed by the engine on save, never fee |
| Net profit / NP % | Extended price less the burdened cost beside it -- after material handling and G&A -- and that as a share of price; red when a line sells below what it costs to deliver. The gross figure the proposal rolls up is in the Total Revenue / Gross Margin tiles above the tabs |
| Basis | Where the price came from; set by hand keeps the basis it overrode beneath the badge; Cost buildup is stamped by the adopt action and reads in the sourced tone. In the drawer that stamp shows as Cost buildup (stated by the adopt action) and is never offered as a choice |
| Origin | Country of origin -- required on every line before the proposal can be submitted |
| Quote | When the vendor quote expires; amber within 14 days, red once past |
Click Add deliverable line. The drawer asks for:
- What is being sold -- Description, Manufacturer, Part number, Vendor part number, CLIN (optional), Quantity, Unit of measure.
- Price -- Price basis (Vendor / distributor quote, Schedule (catalog) price, List price less discount, Prior proposal, Set by hand), which starts empty so that you choose where the price came from rather than accept a default, and Unit price ($); for list less discount, List price ($) and Discount (%) instead, and the unit price is derived on save.
- Cost -- Unit cost ($) and Cost basis (optional).
- Cost volume -- Cost type (recurring, or non-recurring for a one-time cost) and, when the proposal has option periods, Option-year quantities. Cost type is what FAR 15.408 Table 15-2 splits on: a non-recurring line stays out of the recurring unit price, is reported on the NRC line, and does not roll forward into an option year. Leaving it unclassified is allowed and the Table 15-2 sheet reports the unclassified total, so nothing is silently counted as recurring. Option-year quantities let an option year buy a different number of units from the base year -- blank repeats the base quantity, and a different number makes that year a separate lot, which continues the learning curve rather than restarting it. Beside each year is its CLIN, for the usual case where the solicitation numbers the periods separately (0001 base, 0002 and 0003 for the options); blank repeats the base line's CLIN, and an evaluator matches the cost volume to the solicitation on exactly that number. Not separately priced - price carried under CLIN is for a deliverable the solicitation asks for but does not price on its own line, such as a data item whose cost sits inside the NRE CLIN: name the CLIN carrying the price and the schedule prints NSP instead of a price. It is left blank on an ordinary priced line. NSP suppresses the price and never the cost -- any cost you enter on the line stays in the bid, so a line showing cost against no price is telling you that cost is not recovered anywhere.
- Basis and compliance -- Quote reference, Quote expires, Country of origin.
- Billed monthly -- tick it for a subscription or license priced per month, then Term (months), Service start and Service end; price and cost multiply by the term. This is about how often the customer is invoiced, and is a different question from Cost type above.
- Applicable periods -- the periods the line is added to.
If burdens read zero while the rates are set, the proposal's rates are not marked approved; the amber note above the table says so. Lines roll into the proposal totals, Margin Analysis, the period summary and the Excel export.
At the end of each row are three controls: Open this line's component tree, Edit this deliverable line, and Remove this deliverable line. Removing is recoverable — the line stays in the change log and in any version already saved — so a line removed to test a price can be read back rather than retyped.
Generate Periods
Once you have positions, click Generate Periods to create period rows for Base Period + all Option Years. This auto-calculates salary escalation (using your Default Escalation Rate) and extends labor costs and pricing across the entire performance period.
Annual Escalation, and what saving it does
The Annual Escalation panel holds two rates, not one: Salary Escalation (%/yr) and Price Escalation (%/yr). They compound per year against base-period values when option years are generated, and they escalate independently — which is what lets cost and revenue drift apart on purpose, and what makes a margin read wrong when they drift by accident.
Two things about it that the panel says and are easy to miss:
- On a ceiling vehicle the price field is ignored. GSA MAS and similar take bill rates from the published rate schedule, so setting a price escalation there changes nothing. It will still save.
- Per-period overrides win. Anything you set in the Tuning view takes precedence over these defaults.
Saving this panel re-flows option-year salaries, and tells you first when that would cost you something.
Applying a rate is what makes it reach the option years — without it the rate is recorded and changes nothing. But re-flowing replaces option-year salaries, and some of those may have been entered by hand.
So both routes check before they act: saving this panel, and Re-apply Escalation in the header. When no option-year salary would move, the rate is applied and the result is reported. When any would, you are told how many and offered Leave salaries as they are, which keeps your figures and leaves the saved rate waiting until you re-apply it deliberately.
Stage 2: Price
Tab: Margin Analysis
Displays a Revenue to Profit Bridge waterfall chart (cost buildup visualization):
- Revenue (starting point)
- Cost deductions: Direct Labor, Fringe, Overhead, G&A, Subcontractor Pass-Through, Other Direct Costs, Markup on ODCs
- Profit (ending point)
Below the chart are KPI tiles:
- Total Revenue — sum across all periods
- Total Cost — all direct + indirect costs
- Gross Margin — revenue minus direct labor only (before indirects); shown as % and $ amount
- Total Profit — fee dollars captured in the bid
The bridge's own steps are named on the chart, ending at Gross Profit -- revenue less direct cost, which is the figure the proposal totals roll up.
Beside it, the Margin Trend chart plots Revenue, Total Cost and GP % for each period. A bid whose margin decays across the option years shows that as a falling line here, where a single blended number would hide it -- which is the case escalation most often produces.
The All periods bar
Above the position grids, a summary bar totals the whole bid across every period: Revenue, Cost, Gross Profit and GP Margin, with the period and position counts beneath the label. Gross Profit here is revenue less direct cost, before fringe, overhead and G&A -- the same basis as the GP% column in the grid below it, and not the same as the deliverables table's Net profit, which is after burden.
Reading the three margins on a position grid
The position grids show GP%, CM% and NP%, and they answer three different questions. Reading the wrong one is the most common way to misjudge a bid.
| Column | Deducts | What it tells you |
|---|---|---|
| GP% (Gross) | direct labor only | Rate spread before any burden. Ignores fringe, so it flatters a position. |
| CM% (Contribution) | direct labor + fringe | Does this work cover the costs that vary with winning it. The floor a competitive bid has to clear. |
| NP% (Net) | everything, incl. overhead and G&A | Fully absorbed profitability at your current indirect rates. |
CM% is the bid-decision number. Overhead and G&A pools are largely fixed, so they do not grow when you win one more call order — but the rate charged against a bid does not know that. When the direct base shrinks, a fixed G&A pool produces a higher G&A rate without anyone spending another dollar, and NP% turns negative on bids that are competitive and worth winning.
A bid with positive CM% and negative NP% is normal and is not a warning by itself: it contributes toward indirect you are already carrying. A bid with negative CM% is different — it does not cover its own variable costs, and no amount of absorption fixes that.
CM% deliberately stops at fringe rather than picking a house definition of "variable". Whether overhead should count is a judgment about your own cost structure, so the overhead and G&A steps are shown on the Absorption tab, which also estimates how much winning the work lowers those rates for the rest of the portfolio.
CM% shows --, never 0.0%, when a row does not carry the cost components it needs. A blank is a missing input, not a zero margin.
Tab: Ceiling Compare
Displays your proposed rates vs. GSA or contract-ceiling maximums. Useful for identifying when you are pricing at or near the ceiling (risk of customer pushback) or far below (opportunity to increase margin).
Columns are Position, Bill Rate, Ceiling Rate, Discount and Margin to Ceiling — the last is the headroom itself, so it is the column that answers the question above without arithmetic: a small number is pushback risk, a large one is margin you chose not to take.
Click any heading to sort; sorting by Margin to Ceiling brings the positions closest to the vehicle's ceiling rate to the top, and Export downloads the table to Excel. A position with no ceiling rate shows a dash rather than a margin against one, and when no position has a ceiling the tab says so instead of drawing an empty table.
Tab: What-If
A what-if scenario builder to explore margin sensitivity:
- Adjust discount %, salary multipliers, or overhead rates via sliders
- See real-time impact on revenue and margin
- Compare Option A (status quo) vs. Option B (your what-if change) vs. Option C (third scenario)
Tab: Absorption
Shows overhead and G&A absorption rates across labor cost pools. Useful if your accounting system segments indirect costs by direct-labor subtotals (e.g., higher overhead on travel-intensive roles).
Two figures sit above the table — OH Absorbed (Total) and Blended Fringe Rate — and the table runs one row per period with Period, Direct Labor, Fringe, OH Absorbed, G&A Absorbed, Total Indirect and Fringe Rate. The table sorts and exports to Excel, with the total row held at the bottom whatever the sort.
Total Indirect is worth reading against the provisional rates on the Settings rate card: the proposal states its own answer per period here, and the two should tell the same story. Note the two fringe figures are different objects — Blended Fringe Rate is the single figure across the proposal, Fringe Rate is the per-period column.
Portfolio Impact
One button toggles the portfolio view and names the action available, not the
state you are in: View All Positions opens it, and Close Portfolio
closes it again. If it reads Close Portfolio, the portfolio is already
open.
What winning this contract does to your other work. A bigger direct-labor base carries the same indirect pools, so the effective G&A and Overhead rates fall. The header states the two numbers it rests on — your firm-wide direct labor base and what this proposal adds per year — and the Rate Impact table gives Pool, Current, Post-Win and Delta for each.
Who actually keeps that benefit depends on the contract type, and the panel is explicit about it. FFP and T&M capture the compression as margin, because an FFP price is fixed at award and a T&M bill rate is a fixed wrap over labor. Cost-plus contracts re-bill at actuals, so their customers absorb the change — the rate still falls, but the saving is not yours.
Two amber lines can appear, and each one means the numbers are not what they look like:
- No closed-period actuals yet for the current fiscal year — the compression cannot be estimated at all, and you are seeing portfolio mix only.
- No indirect rate configuration is filed — Current G&A and Overhead read 0%. That zero is a missing configuration, not a favorable rate, and it is worth being careful about because this is the panel someone reaches for to justify a discount. File the rates on the Settings tab; this panel reads the same filed rates your bids price from.
Tab: Market Rates
Displays competitive labor-category rates from CALC+ market data (if available). Helps you position your bid in the market.
Tab: Period Summary
Tabular breakdown of revenue, cost, and margin by Base Period and each Option Year. The Period Summaries table carries the figures and Revenue vs Cost by Period plots the same data, which is where a single bad option year shows up as a shape rather than a row you have to spot. Margin Trend shows GP% across the periods with the out-of-range years colored, and Target Blended GP Margin % sets the figure the whole proposal is aiming at — distinct from the per-position Target GP% in Margin Targeting below. Until periods have been generated and priced, the tab explains what it is waiting for rather than showing an empty panel.
Margin Targeting
Applying a target rewrites priced positions, so it asks first. The confirming button reads Yes, Apply and shows Applying… while it runs.
At the top of Stage 2 is a Margin Targeting panel:
- Enter Current GP% (auto-populated from the waterfall)
- Enter Target GP% (e.g., 18)
- Click Apply Margin Target
The system re-calculates the discount % across all positions to hit your target margin. Useful for rapid bid tuning.
Stage 3: Validate
Market-rate validation against your prior bid wins and CALC+ benchmarks.
Tab: Market Rate Validation
-
A Run Market Benchmark button loads CALC+ position data (loads automatically on workspace open; refresh to reload).
-
For each of your positions, see:
- Position name and pay type
- Your proposed rate
- Market Median (50th percentile from CALC+)
- Delta % — how far above/below median
- Status — Competitive (within 5%), Above Market (>10%), or No Data
-
Position colors:
- Green (Competitive) — pricing aligned with market
- Amber (Above Market) — higher than median; may need defense in proposal
- Gray (No Data) — no CALC+ benchmark available
-
Below the summary, the full benchmark table gives the distribution rather than just the midpoint:
| Column | What it holds |
|---|---|
| Position | The labor category being benchmarked. |
| Our Rate | Your proposed rate. |
| Mkt P25 / Mkt Median / Mkt P75 | The CALC+ spread — lower quartile, midpoint, upper quartile. |
| Percentile | Where your rate falls in that distribution, shown as P62. |
| vs Median | Your distance from the midpoint, signed. |
| Sample (n) | How many CALC+ records the row was computed from. |
Selecting a position also draws a Market Distribution bar for its labor category, marked at P10, P25, P50, P75 and P90.
The tails are what the table's quartiles cannot show you. A narrow P10-to-P90 spread means the market agrees on this category, so the median is a strong summary and a small delta is meaningful. A wide one means the opposite — your position within the band tells you more than your distance from the midpoint, and a rate that looks off-median may be entirely ordinary.
Two things this table shows that the status badge cannot.
Blue means you may be under-priced. vs Median turns amber more than 10%
above the midpoint and blue more than 10% below it. The badge has
only Competitive, Above Market and No Data — no wording for under market —
so a position priced well below the median reads as "Competitive" there and as
blue here. That is margin you may be giving away, and only this column shows it.
Check Sample (n) before you trust a median. A midpoint drawn from three
CALC+ records and one drawn from three hundred look identical everywhere else
on the screen. Nothing stops you pricing against a thin sample — this column is
how you notice you are doing it.
Vehicle Compliance Caps (if configured)
If your vehicle has pass-through cap or prime fee cap rules, violations display at the top in an amber warning box. Address these before submission (e.g., reduce sub markup or fee rate).
Stage 4: Compare
Competitive analysis and portfolio positioning.
Incumbent Intelligence and Competitor Positioning
Two panels open the stage and set up everything below them.
- Incumbent Intelligence — who holds the work today, each entry carrying its Contract number and obligated Value. When it is empty it says why and what to do: "No incumbent data. Use Market Intel to import USAspending data."
- Competitor Positioning — one entry per competitor you have loaded, with how many LCATs each has on file. Choosing one here is what the Competitor Crosswalk and the Total Contract Value chart below then compare you against, so this is the selection those sections assume you have already made.
Bid History Integration
View your prior wins and losses with this customer (if linked in Bid History tab) to inform pricing strategy.
Competitor Crosswalk
- Search for competing vendors in CALC+ using the search bar (Search CALC+ vendors...).
- Select a competitor to load their LCAT catalog.
- Click Build Crosswalk to map your positions to theirs.
- The crosswalk table pairs each of your positions with theirs:
| Column | What it holds |
|---|---|
| Our LCAT | Your labor category. |
| Comp LCAT | The competitor category it was mapped to. |
| Our Rate / Comp Rate | The two billed rates, side by side. |
| Delta% | How far yours sits above or below theirs. |
| Status | Whether you have accepted the mapping — see below. |
Status is not a verdict on the price. It is where you judge whether the
mapping itself is right: an unreviewed row offers Confirm and Reject,
and once you choose it reads Confirmed or Rejected. The crosswalk is a
proposal awaiting your judgment, not a finished answer — reject the pairings
that are not really the same job, or every number built on them is comparing
different work.
The competitiveness reading is separate, in the summary strip beneath the table: a single badge — competitive, expensive or Neutral — beside a count of how many positions matched, how many are cheaper and how many more expensive.
Rate Card Comparison (collapsible)
Position by position, against the market and against everyone you have loaded: Position, Our Rate, Disc%, CALC+ Median, vs Median, and then one column per competitor.
The rate cells are color-coded against whichever reference the column carries — green below about 95% of it, amber up to about 105%, red above. vs Median uses a wider band: green beyond 5% below the median, red beyond 5% above, neutral in between. A dash means there is no comparable rate on that competitor, which is different from being level with them.
GP Margin Sensitivity
Gross-margin percentage across a sweep of discount adjustments, in percentage points. A diamond marks where your proposal sits now, and a dashed line labeled Base: marks where it started — so the chart answers how much margin does the next point of discount actually cost, rather than reporting one number.
Total Contract Value vs Competitors, and the number it rests on
Beneath the crosswalk, this chart plots your total across a sweep of discount adjustments against each competitor's total, so you can see where the lines cross rather than comparing single rates. Your line is the one labeled Our Bid in the legend; the rest carry the competitors' names.
It depends on an assumption you supply. The panel header carries an Assumed Comp. Discount % box (0–50). A competitor's published CALC+ or schedule rate is a ceiling, not what they would actually bid, so the chart discounts their catalog by this figure before totaling it.
Set it wrong and the crossing point moves — the chart stays just as confident, and nothing on the screen marks the result as an estimate. Treat the comparison as "what happens if they bid this far below their catalog", and change the number when you have better intelligence on a particular bidder.
Price-to-Win
Price-to-Win reads your decided bids by agency and vehicle and sets your win rate beside the discounts you won and lost at: Agency, Vehicle, Bids, W / L, Win Rate, Avg Win Discount, Avg Loss Discount, Price Gap (Loss), Below / At / Above and a Recommendation. Each heading opens its help. Sort by win rate, a discount or the price gap, and Export downloads the table to Excel.
A cost-plus contract has no ceiling rate, so discount analysis does not apply to it and its discount columns say so rather than showing a figure. A row that needs both winning and losing rate data says when one side is missing.
Stage 5: Submit
Audit Checklist
Submit & Run Checks runs the checklist and reads Running checks... while it works. It is one action: the checks run as part of submitting, not as a separate step you can take first.
A mandatory checklist before submission:
- Confirm all periods are priced
- Confirm vehicle compliance (no cap violations)
- Confirm escalation is applied to Option Years
- Confirm fringe/overhead/G&A rates are reasonable
Click Sign Off & Attest to lock the audit and sign off. The button appears only once the audit has run and every check is resolved. A signed submission audit (dated today or later) is required before you can transition the proposal to Submitted status.
Version Panel
Displays all prior versions (snapshots). When you open a BAFO (Best & Final Offer), the original submission is snapshotted here. You can restore prior versions if needed.
Saved Versions
Every saved snapshot of the proposal, each with its label, who created it, when, and a control to restore it. BAFO rounds land here automatically; you can also save a version by hand before a change you may want to walk back.
This is the only place a prior state can be recovered from — the Change Log tells you what moved, and Saved Versions is what puts it back.
Basis of Estimate
The draft button names what it will do to what is already there. With no basis of estimate on file it reads Draft with the model; once one exists the same button reads Redraft, and redrafting replaces the text.
The confirm button distinguishes confirming a draft from confirming your own edit. It reads Confirm for text as drafted, and Confirm edit once you have changed the text yourself. Either way the confirmed text is what prints in the workbook, and it stands until it is redrafted or re-confirmed.
The prose an evaluator reads beside your numbers. It sits on Stage 5 between the version panel and the audit checklist, and nothing on it changes a number.
Arcvue drafts it from the bid as priced. Every figure the draft states is one the bid actually holds — it does not restate your pricing from memory and it does not round. The heading is Basis of estimate and the editor beneath it is Basis of estimate text.
The interesting part is what it refuses to write. If the drafter cannot support a paragraph from the priced bid, it drops that paragraph and tells you how many it held back rather than writing a sentence the numbers do not carry. So a draft that comes back shorter than you expected is the drafter declining, not failing — read the held-back count as a list of things the bid does not yet say.
Then a person edits and confirms it, and the confirmed text prints in the workbook. Draft and confirmed are different states: until you confirm, nothing goes to the workbook.
A bid edited after the text was written shows as stale. That is the whole point of the state — reprice a line and the narrative beside it is no longer describing the bid you are submitting. Clear it by redrafting (take the new numbers) or by re-confirming (keep your wording against the new numbers). Both are deliberate acts, because only you know whether your paragraph survived the repricing.
Notes (collapsible)
Free-text notes attached to the proposal for internal discussion. The panel is headed Proposal Notes.
Change Log (collapsible)
Full edit history: who changed what, when, and why (if a reason was entered).
Proposal Status Transitions
At the top of the workspace header, action buttons appear based on your role and proposal status:
- Draft → click Send for Review to move to In Review
- In Review (admin/CEO/COO/finance lead only):
- Approve & Submit → moves to Submitted
- Return to Draft → revert for more edits
- In Review (others): you see Awaiting admin approval (grayed out)
- Submitted:
- Request BAFO → customer asks for revised pricing. The prior submitted state is snapshotted into Saved Versions as Original Submission (first round) or BAFO Round n - Pre-Edit after that. Check it is there before you start editing — that snapshot is what preserves the original price for compliance reporting.
- BAFO Open (admin only):
- Resubmit BAFO → finalize the BAFO round
Once Submitted or BAFO Open, the Mark Outcome menu lets you record how it ended:
- Mark as Won — confirmed award
- Mark as Lost — customer selected competitor (prompts for a reason; the options are fixed and listed below)
- Mark as Canceled — you withdrew or the customer canceled
- Mark as DQ — disqualified (prompts for a reason of its own)
- Mark as No Bid — decided not to pursue (prompts for a reason of its own)
Why it ended — the reason prompt
Marking a bid Lost, DQ or No Bid opens a prompt, and it is a different prompt for each: Why was this bid lost?, Why was this bid disqualified?, Why did we decide not to bid?. Each offers its own fixed list, so the reasons are not interchangeable between outcomes:
| Outcome | The options you get |
|---|---|
| Lost | Price · Technical · Incumbent Retained · No Bid Decision |
| No Bid | Strategic Fit · Resource Constraints · Price Floor Too Low · Cannot Compete · Past Performance Gap |
| DQ | Late Submission · Non-Compliant Format · Missing Documents · Past Performance Insufficient · Eligibility / Set-Aside |
Other is on every one of them, and it requires you to type something — the confirm button stays disabled until you do, so Other cannot be used to get past the dialog without saying anything.
The three ways out are not the same thing, and this is the part worth knowing. Cancel abandons the status change entirely — the bid stays as it was. Skip (record as unknown) completes the status change and writes the reason as unknown, which is a recorded answer rather than a blank. Choosing a reason completes it with that reason.
Why that matters more here than on most dialogs: this answer is not bookkeeping. A loss reason feeds the win/loss intelligence and the pursuit scoring that ranks future opportunities; a no-bid reason is read in capture-strategy review; a DQ reason is read in compliance review. A skipped reason therefore does not simply leave a gap — it puts unknown into the input those reviews read, and unknown is indistinguishable from a bid nobody could explain. Thirty seconds on the real reason is the whole value of recording the outcome at all.
When a proposal is submitted or marked with any outcome above, the system syncs it to your Bid History: it looks for a record of the same bid — matched on the agency's solicitation number or the GSA eBuy RFQ number (a bid can carry both, each in its own field, and either one identifies it), corroborated by the opportunity name or value — and auto-updates its status; if no match exists, a new bid record is created automatically.
The Vehicles Tab
Manage contract vehicles (GSA schedules, IDIQ, BPA, custom rate pools, etc.).
- Click Add Vehicle to create a new rate pool.
- Enter:
- Vehicle Name (e.g., "GSA IT-70 2024–2026")
- Vehicle Type (dropdown: Ceiling Price, Cost Buildup, Cost-Plus, GSA Back-to-Back, Custom, Open Market)
- Once created, click the vehicle card to open its details drawer and configure:
- Contract Number and Ordering Agency — how the vehicle is identified on an award. Both are free text.
- Contract Access Fee (%) — see below; this is the one field on the drawer that changes a price.
- LCATs — labor category list with their ceiling rates (pulled from GSA, imported, or user-entered)
- SINs — (for GSA) Schedule Item Numbers covered by the vehicle
- Rate Caps — (optional) pass-through cap %, prime fee cap %
Contract Access Fee, and the way it gets counted twice
Enter it as a percent — 0.15 means 0.15%, not 15%. The engine multiplies
revenue by that rate in each period and adds the result to total cost.
The field is not "this vehicle's fee". It is "the fee that is not already inside the rates." Some vehicles publish rates with the fee baked in, and on those the correct entry is 0 — the screen names GSA MAS as that case, because the IFF is already in the published schedule rates. Vehicles that charge it on top do need it here; the screen's own examples are OASIS+ at 0.15% and CIO-SP3 at 0.55%.
Get this wrong in the direction of entering a fee that is already in the rates and the bid is high by that percentage, with nothing on screen to say so. The number looks right, every position is right, and the total is wrong. Check the vehicle's own rate documentation for whether the fee is embedded before you type anything but 0.
The rate belongs to the vehicle, not to your company — different vehicles carry different fees, so there is no single right value to copy from one to the next.
The LCAT table
LCAT, Year 1, Year 2, Year 3 — the ceiling rate for each year of
the vehicle. Import GSA loads them from a GSA rate spreadsheet (.xlsx), and
Add LCAT creates a blank row you then rename and rate.
A vehicle that carries a single flat rate rather than a rate per year shows that rate under Year 1 with Years 2 and 3 empty. That is the vehicle having one rate, not a failed import.
Once you link a vehicle to a proposal and add positions, the vehicle type determines how labor rates are sourced. GSA vehicles pull from the live GSA rate files; CEILING and COSTPLUS pull from your uploaded rate tables; CUSTOM and OPEN_MARKET require user-entered rates.
The Bid History Tab
Track historical bids and win rates to benchmark future pricing.
Summary KPIs
- Total Bids
- Won (count)
- Lost (count)
- Pending
- Win Rate — bids won over bids decided
- Dollar Win Rate — value won over value decided, with the number of bids behind it. These are different answers, not one rounded twice: on a book of many small wins and a few large losses the first reads healthy and the second does not.
- Value Won (revenue booked), with value lost beneath it
Sub-tabs
- Win Rate Analysis — by vehicle, customer, division or work type. Columns are Group, Bids, Won, Lost, Win Rate, Dollar Win Rate, Value Won and Value Lost. The Group by: selector chooses what the Group column holds — vehicle, agency, division, year submitted, work type, work category, company, contract type, set aside or position.
- Win Rate counts bids; Dollar Win Rate counts the money, computed over the bids that record a proposed value, with that count printed beneath it. Where no bid in a row records a value it says so rather than showing 0%, which would read as winning none of the money instead of not knowing. A bid NEO recorded carries the total of the Pricing proposal linked to its pursuit once that proposal is submitted; with none, it records no value, never NEO's estimate, so it stays out of the dollar rate until you give it one on Bid Records.
- Rows group under Unspecified when the bid records nothing in that column, so the rows always sum to the Total Bids figure above. A cut that does not foot to that number is dropping bids.
- A division the tenant has not configured is marked unmapped and reported on its own rather than folded into a division nobody established. Reassign those bids on the Bid Records tab, or add the name to your division list.
- Price Analysis — three panels, and this is where bid history earns its keep:
- Price-Driven Losses — Price Losses (how many you lost on price rather than anything else), Avg Price Gap and Gap Range.
- Loss Reason Breakdown — Reason, Count and Avg Price Delta, so you can see whether the reasons you lose most often are also the ones you lose by the widest margin. The delta is averaged over the losses that record one, and says how many that was when it is fewer than the row's count.
- Uncategorized loss notes — the free-text reasons somebody wrote about a single bid. They are listed rather than counted, because one sentence about one pursuit is not a category, and counting it as one puts a breakdown row of one bid beside the real reasons. Nothing is discarded: these are often the most useful lines on the tab.
- Win Pricing — Avg Gross Margin on Wins and Avg Discount from Ceiling (Wins): what winning has actually cost you.
- Agency Profiles — win/loss trends by customer, with Agency, Bids, Won, Win Rate, Dollar Win Rate, Price Losses, Avg Price Gap, Value Won and Value Lost. Every column counts decided bids, so the numerator and the denominator describe the same population. Every agency is listed, including those with a single decided bid; Hide agencies with one decided bid collapses those when you want the pattern rather than the tail.
- Records — full flat table of all bids with edit, link, and delete actions
Win Rate Analysis and Agency Profiles sort, filter and export to Excel with a frozen header, like every other table in Financial Intelligence, so you can rank customers by win rate or by value won instead of reading down a column.
The analytics sub-tabs are scoped by All Statuses, All Companies and All Agencies at the top. Those filters apply to the panels above — a gap or win-rate figure read while one is active is a figure for that subset, and the panels do not restate the filter beside the number.
Read Avg Price Gap before you change a price. A narrow gap means the bid was competitive and the decision is worth revisiting; a wide one means it was never close, and the lesson is in which pursuits you take rather than what you charge for them. The two look identical in a raw loss count, which is why the gap is reported beside it — and why Agency Profiles carries the gap per customer: one agency you consistently lose narrowly to is a different problem from one you were never in contention for.
What a bid record holds, and why it matters
Open a record in Records and it carries Decision Date, Awardee, Winning Bid ($), Win/Loss Reason and the Award Amount alongside your own bid.
Those fields are what the Price Analysis sub-tab runs on. Avg Price Gap, Gap Range and the Loss Reason Breakdown cannot be derived from an outcome alone — they need the number the winner bid and the reason you were told. A loss recorded without Winning Bid ($) still counts in your win rate and contributes nothing to the analysis that would tell you why, so the panels read thin and nothing explains the emptiness.
Fill them when the debrief happens, while the number is still to hand.
Link Bids to Proposals
- In the Records tab, select a bid record.
- Click Link (the chain icon; it reads Link to proposal on hover) and choose the matching active proposal.
- The system updates the proposal's sidebar metadata and adjusts Stage 4 pricing recommendations based on this customer's history.
Import Bids
- Click Upload (in the header) to import a CSV or Excel template.
- Match columns: Solicitation #, Customer, LCAT, Bid Rate, Discount %, Outcome (Won/Lost), Win Date, etc.
- Click Import. Each row is reconciled on its government solicitation number, so a bid that already exists — from an earlier import or from a proposal you marked Won or Lost — is updated in place rather than duplicated; genuinely new bids are added. Distinct task orders that share one IDIQ/MATOC vehicle number stay separate, and placeholder solicitation values (such as "TBD" or "Not Provided") never merge records. The confirmation toast reports how many bids were imported and how many were updated.
Price-to-Win Analysis (the table at the bottom of this tab)
This is not the same thing as Price-to-Win on Stage 4. That one is a recommendation for the bid you are pricing right now. This one is a tenant-wide historical table: one row per (agency, vehicle) combination, built from bids that have already been decided. Same words, different question — Stage 4 asks "what should I price this at", and this asks "what has actually won here before".
A combination appears once it has three or more decided bids with pricing positions captured. Below that the panel says so rather than showing a row built on one data point.
| Column | What it is |
|---|---|
| Agency | the buying agency |
| Vehicle | the contract vehicle, with a CP badge if that combination is cost-plus and a mixed badge if only some of it is |
| Bids | how many bids make up the row |
| W / L | wins and losses, counted |
| Win Rate | wins over decided bids. Banded green at 40% and above, amber from 20%, red below |
| Avg Win Discount | how far below the combination's median the winning bids priced |
| Avg Loss Discount | the same for the losing bids |
| Price Gap (Loss) | the distance between those two, in percentage points — how much cheaper the winners were than the losers |
| Below / At / Above | three counts: how many bids priced below the band, at it, and above it |
| Recommendation | the target this history suggests |
Win Rate counts decided bids only. Canceled, Pending, DQ and Lost-Exclude bids are not in the denominator, so a combination can show fewer bids here than you remember submitting — the missing ones are the undecided and the excluded, not an error.
Everything here is relative to that combination's own median, not to a benchmark. "Below" means below what has historically been bid for that agency on that vehicle. Two rows with the same discount figure are not comparable to each other.
Cost-plus rows do not show a discount, and that is correct rather than missing. A cost-plus contract has no ceiling rate to discount against, so discount analysis is undefined — the discount cells read cost-plus and the recommendation reads N/A — cost-plus. A zero there would be a fabricated figure. A row badged mixed is telling you only some of its bids are cost-plus, so read its discount columns as covering the part that had a rate to compete on.
The discount columns only count bids whose rates were captured, and the table
says so rather than going quiet. With partial coverage you get the average and
the count on hover — "3 of 5 winning bids have rate data captured". With no
coverage at all you get — (5·0 rated), which means five bids, none of them
rated — it is not saying there were no bids. Price Gap (Loss) needs rate
data on both sides and tells you when it only has one.
To fill an empty discount column, add the ceiling and proposed rates on that bid's own detail page. What is missing is captured data, not a calculation.
The Audit Tab
Global proposal audit — run across all proposals to identify pricing inconsistencies, missing data, or compliance gaps.
-
Audit Overview — all proposals filtered by audit status (Incomplete, Warnings, Passed)
-
A review's results are a table of Question, Declared, System and Status — what you asserted beside what the system computed, one row per check. The status reads match or confirmed, discrepancy, warning, or info / unverifiable, and the counts appear as pills above the table. A discrepancy carrying a resolution note is shown differently from a bare one, so an explained difference is distinguishable from an unexamined one.
-
Drill into any proposal to see specific audit findings and remediation steps
-
Pricing Compliance Review Runs — the history of reviews, with two ways to start one:
- Start Full Audit — an ad-hoc pass over the proposal
- Submission Audit — the pre-submission check
Both open a declaration form of questions to answer, and both exits return to this run history — but they are not the same act. ← Cancel, on the question form, leaves without submitting, so answers typed and not submitted are gone. ← Back to runs, on the results view, leaves a completed review whose findings are saved. The wording is the difference: cancel while you are still answering, go back once there is something to come back to.
The overview can be missing proposals, and it tells you when it is. If more proposals exist than it could load, a line appears reading "Only N of M proposals could be loaded — this overview may be missing audited proposals."
Read that line before treating the tab as a clean bill of health. It is absent on an ordinary day, which is exactly what makes it easy to skip past on the day it is not — and an audit view that is quietly partial is worse than no audit view, because it is the screen you would point at to say everything was checked.
The Change Log Tab
Each entry in Change History records what moved, with Old Value and New Value side by side, so a rate that looks wrong today can be traced to the edit that set it.
Global change history across all proposals. Filter by user, date range, or change type to audit who updated what and when.
Related
Edit Details — Click the pencil icon in the workspace header to adjust:
- Proposal name, solicitation #, agency, customer, contracting office
- Indirect rates (fringe, overhead, G&A, fee, M&H, hardware) — stored as percentages
- Escalation rates — salary vs. price escalation (can diverge per period)
- Cost Volume — Freight-in (% of material) and Warranty reserve (% of burdened cost), both applied per period by the engine so they follow a quantity change instead of being computed off-line; and Non-recurring treatment, which decides whether the Table 15-2 sheet shows a recurring unit price plus its own NRC line (Separate CLIN, the default and what FAR prefers) or one all-in unit price with non-recurring cost spread into it (Amortized). The sheet states the treatment in its own header, so set it to match the solicitation. Under Amortized, give each one-time ODC an Amortize over quantity.
- Rate-application gates — has approved rates? allow ODC markup?
- Include FAR 52.217-8 extension — adds an EXT8 period at last-OY rates, with hours scaled to Extension months: (1–12, default 6)
- Standard work hours / year — convention for this contract (default 1920)
After saving, if escalation rates changed, the rates are re-flowed to the Option Year positions. If that would replace option-year salaries that differ from the escalated values — including any entered by hand — you are told how many and asked first.
Recompute — Recalculate all derived fields (used after indirect-rate changes or bulk edits). Click the refresh icon in the header.
Save Version — Snapshot the current proposal state with a timestamp. Useful before major edits or before submission. Versions are read-only; to edit, clone the proposal or create a new one.
Export to Excel — Download the entire proposal (positions, periods, economics, audit results) as an Excel workbook. Includes all tabs and charts.
See all labor categories — (Add Position drawer) Opens a browsable table of
every labor category on the proposal's vehicle. The search box beside it returns
nothing until you type, so this is the way in when you do not already know a
category's name. Columns: code, full Title (the search field is one line and
truncates long titles — this wraps), the base-year rate the engine would bill
after any vehicle discount, Min education, Min YoE, and SCA classification.
Sort by code or by rate; filter by code or title. Categories outside the
proposal's SIN are hidden and, when revealed, cannot be selected.
Min education / Min YoE — (See all labor categories) The minimum
education and years of relevant experience the vehicle requires for a category.
They constrain who you may staff, not what you may charge, so read them
before committing a named person to a line. They appear only on vehicles that
publish qualifications — the GSA schedules do; agency IDIQ and BPA vehicles
generally do not, and the pane says so rather than showing empty cells. An empty
column would read as "no minimum", which is a different claim from "we hold no
requirement on record". To correct a value, edit the category on the vehicle.
Create Proposal — the heading of the new-proposal dialog, and the control that submits it. It stays disabled until every required field is set.
Select proposal... — on a bid row in Bid History, the picker that links that bid to one of your proposals.
No-Bid — a bid status, and one of several that are not a final disposition. Outcome fields only mean something once a bid is Won or Lost, so on a No-Bid (or Pending, Submitted, Canceled, DQ, Extension) the outcome column reads No Action rather than counting anything as missing.
Contractor — the first column of the Incumbent & Market Data table, beside Contract, Award Amount and Period: who holds the work today.
NON_SCA — the default SCA classification a position takes when the labor category you picked does not carry one. It means the position is not covered by the Service Contract Act, so read it as an assumption until you have checked it, not as a finding.
Not classified — the empty choice on an ODC's cost type, beside Recurring and Non-recurring. Leaving it here is allowed and is reported as its own total, so nothing is silently treated as recurring.
— proposal rate — the default on a component's Overhead pool: no pool named, so the proposal's own overhead rate applies. Pick a pool only when that part's labor is burdened by a different one.
Unlink — detaches the proposal from the NEO pursuit it was linked to. It breaks the link only; nothing about the proposal's own pricing changes.
Pricing Indirect Rates — the heading of the DCAA provisional rate card, reached from the Settings tab.
Close without saving — the × on the deliverable drawer. It is labeled for what it does: the drawer discards anything you typed and did not save.
Import CSV — (Top-level button) Bulk-adds labor positions from a .csv
file, through a three-step dialog headed Import Positions: Upload,
Map Columns, Preview & Import.
There is no template to match. The upload step says so — any column names work, and you map them in the next step. It suggests the headers it recognizes most readily (LCAT, Position, Hours, Rate, Salary, FTEs, SCA), and those are a hint about your spreadsheet, not a required set.
Map Columns pairs each of your columns with a platform field. The wizard pre-fills what it can infer from your header names and you correct it.
Moving between the steps. ← Back returns to Upload — which means choosing a different file, so the mapping you have done is for the file you chose. Continue → Preview advances, and it stays grayed out until every required field has a column against it: a grayed-out button here is the wizard telling you a required field is still unmapped, not a fault. From the preview, ← Back to mapping returns to correct a pairing without re-uploading. LCAT / Position is the only required field, marked with an asterisk; Hours / Year, Bill Rate (Ceiling), Pay Rate (Hourly), Annual Salary, Discount %, # of Personnel and SCA Classification can each be left at — Skip —.
Preview & Import shows the first five mapped rows and how many more there are, and then asks for a Target Proposal. The import goes to the proposal you pick here, not to whichever one you had open — and the import control stays disabled until you have picked one. If you have more proposals than the selector can list, it tells you so and says to open that proposal directly and import from within it.
How to Know It Worked
After you've created and advanced a proposal through the five stages:
- The left rail shows all five stage tiles; the active stage is highlighted in green.
- The workspace header displays your proposal name, vehicle type, contract type, and current status (Draft, In Review, Submitted, etc.).
- KPI tiles on the right show Total Revenue, Total Cost, Gross Margin %, and Total Profit.
- Each stage displays its summary line (e.g., "5 positions · 2 periods · $1.2M est. direct cost" for Build).
- The Advance to [Next] → button is active only when the stage prerequisites are met (e.g., Build requires at least one position with salary).
- When you transition to Submitted and the audit is signed, the proposal appears in reports and portfolio views; when marked Won/Lost, it flows to historical analytics.
Building a deliverable's cost from components
A saved component can also carry the vendor's quantity price tiers -- $310 at 100-299, $285 at 300 and up. Add a tier with its min qty and unit cost; the engine prices the part at the deepest tier the order reaches and falls back to the component's own unit cost when none applies. Min qty is total pieces purchased across the whole order -- gross per unit times the units already built plus this lot -- so an option year buying against a blanket order placed for every period reaches a tier the base year cannot. Tick Firm through the option years when a blanket order or firm quote locks the price: a firm tier carries into the generated option-year lines unchanged, while an unmarked tier escalates with the rest of the material. Remove this tier is a re-pricing rather than a tidy-up: the part immediately prices at the tier below it, or falls back to its own unit cost if that was the only tier on it.
A deliverable line's cost can be built up from a component tree instead of typed. Open the tree with the boxes control on the line. Each row shows the Component (indented by where it sits in the assembly), its Qty/unit (per one unit of its parent), Scrap / Yield, material Unit cost, touch-labor Hours and Rate, the learning Curve, the OH pool that burdens its labor, and Burdened labor (build) — the touch labor on that part, burdened and extended across the whole build, computed by the engine on save. A part with no touch labor reads zero in that column: its material cost sits in Unit cost and is burdened through the line's own material handling and G&A, because routing a labor dollar through the material chain would burden it twice.
Adding or editing a component asks for its Description, Qty per parent unit, Scrap % and Yield % (both raise the gross material bought per good unit — a yield at or below zero is refused), Material unit cost, Touch labor hours and Labor rate, the Learning curve % (Wright unit curve: average hours fall to that percent each time the build quantity doubles), and the Overhead pool for its labor. A line with components has its unit cost derived by the engine — a typed unit cost is refused while components exist — and a leaf component with no material cost and no priceable labor blocks submission the same way an unpriced line does.
Each component row ends with Add a child component — which nests the new part under that one rather than beside it — Edit this component, and Remove this component and its children.
Removing a component removes everything under it. On an assembly that is the sub-tree, not the one row you clicked, and the line's unit cost re-derives immediately without it. There is no confirmation step, and the toast that follows says so only after the fact.
When the accounting structure defines more than one overhead pool, positions carry the same choice in the grid's OH Pool column: blank applies the proposal's single overhead rate, and the choices are the pools with a rate in the proposal's snapshot. Rates are filed per pool on Admin > Pricing Rates; Refresh rates on the proposal re-snapshots and reprices, and refuses if it would strand an assignment.
When a figure is missing, loading, or could not load
Every column header on the pricing grids opens its help when you hover over it or click it.
A dash is not a zero. A margin, wrap or ceiling margin that has not been calculated, such as a position nobody has priced, shows a dash, and the workspace totals say when a figure is still loading or could not be retrieved rather than showing $0 or 0.0%.
A panel that could not load says so. The proposals list, positions, period breakdown, cost trace, market intelligence, notes, change history, contract vehicles, the proposal portfolio, and the competitor and incumbent panels each report a failed request, with a retry where one helps, instead of an empty tab that tells you to create or import something you may already have. Reload before re-entering anything.