Financial Statements (Balance Sheet / Cash Flow / Covenants) — User Guide
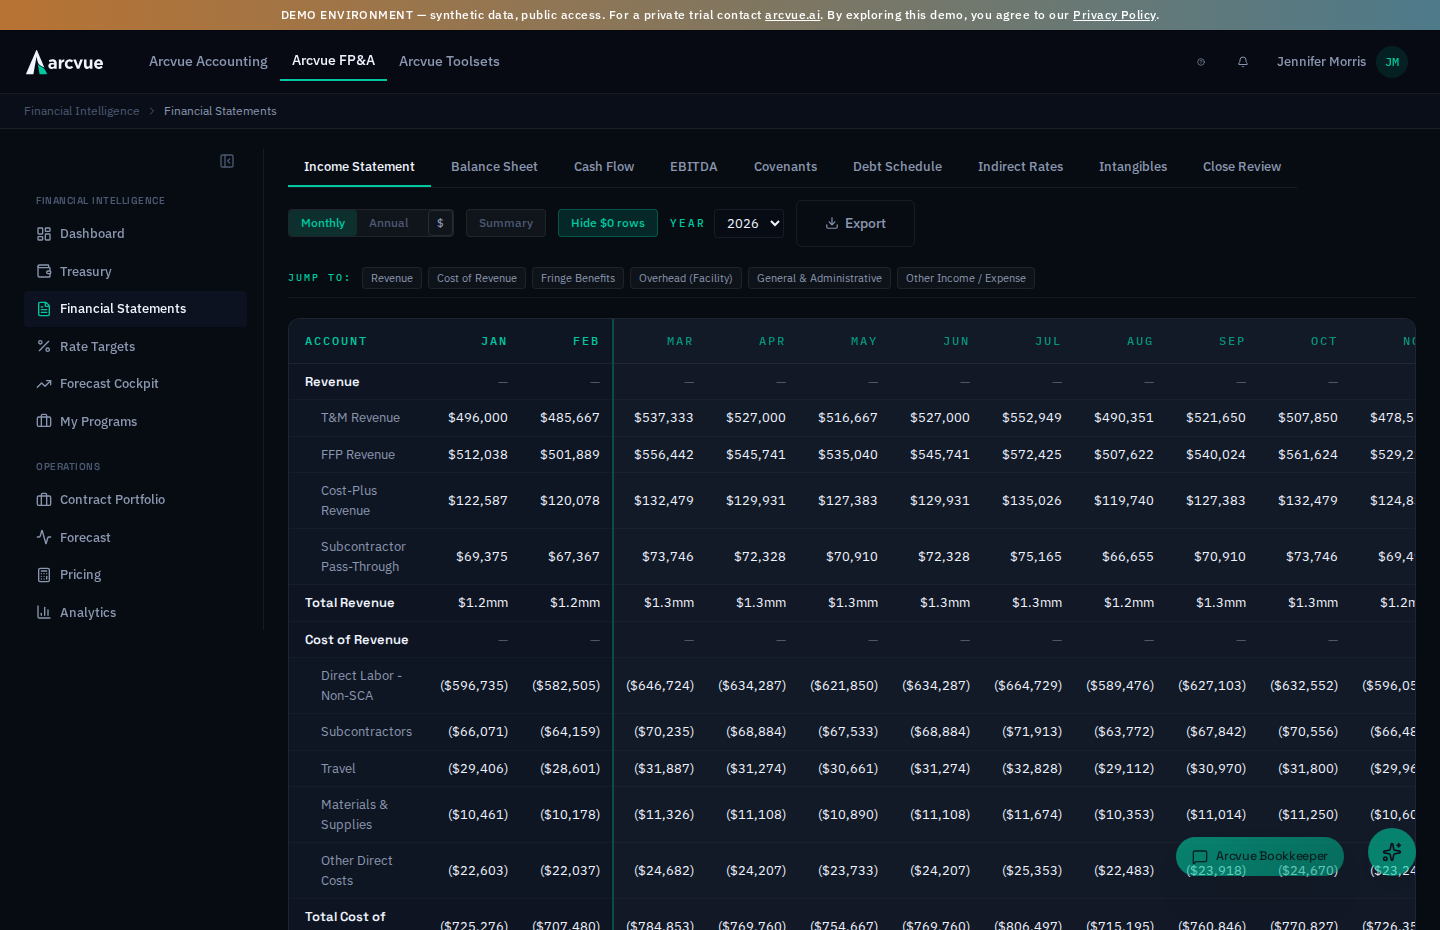
The Balance Sheet, Cash Flow, and Covenants tabs sit alongside the Income Statement on the Financial Statements page. Together with the Income Statement they form the complete three-statement financial model. These views are computed: the engine reads your P&L, debt schedules, and balance-sheet assumptions and projects month-by-month balances through your planning horizon.
Who uses it: CEO, COO, and CFO.
Finding it
In the left navigation, open Financial Intelligence → Financial Statements, then click the Balance Sheet, Cash Flow, or Covenants tab along the top of the page.
Balance Sheet
The Balance Sheet lays out Assets, Liabilities, and Equity as month-end balances. Each period column is labeled "As of {month} {year}", and — like the Income Statement — closed months are shown as actuals while later months are the projection, with the forecast columns lightly shaded past the books-close boundary.
- Use Monthly and Annual to switch between a 12-month year and multi-year columns.
- Use Summary to collapse to the Asset / Liability / Equity section rows, and Hide $0 rows to drop empty accounts.
- Cash is the plug — it balances the sheet after every other line is projected, so the Balance Sheet always ties out.
Cash Flow
The Cash Flow tab presents the Cash Flow Statement in the standard three sections — Operating, Investing, and Financing — using the same monthly/annual layout and the same actuals-then-forecast boundary as the other statements. Cash from operations is driven by net income and working-capital movements (AR and AP), so it stays consistent with the Income Statement and Balance Sheet.
Covenants
The Covenants tab monitors your debt covenants against the actual debt schedule — independent of the Scenarios sandbox, which is a separate what-if tool.
- Covenant Thresholds are shown at the top: Leverage (must stay at or below the configured maximum, e.g. ≤ 3.5x) and DSCR (must stay at or above the configured minimum, e.g. ≥ 1.2x).
- The Actuals + Forecast table lists, per year: Adj. EBITDA, Funded Debt, Debt Service, Leverage (with a status badge), and DSCR (with a status badge). Pre-close months use actuals; post-close months use the locked forecast. Adjusted EBITDA includes bank-approved add-backs.
- Status badges: Pass (green) clears the covenant; Tight (amber) passes but with a thin cushion — within 25% of the threshold; Fail (red) breaches; N/A when there is nothing to measure.
- Sort and export. Click a column header to sort the table by that measure (the Status columns are not sortable). The Export button above the table downloads it as a branded, print-ready Excel workbook — a ready-made attachment for lender and covenant reporting.
If the tab is empty, it prompts you to configure debt instruments in Treasury, then set DSCR / Leverage thresholds in the Setup Questionnaire — its Debt and Covenants section. There is no covenant screen under Admin; covenants are read here and nowhere else.
Set your thresholds before you trust a badge. That prompt appears only when the tab has nothing at all to show. If you have configured debt instruments but have not yet entered your covenant thresholds, the tab populates anyway: it falls back to Arcvue's default thresholds, displays them under Covenant Thresholds, and computes Pass / Tight / Fail against them. Nothing on the screen marks a figure as a default rather than yours.
Those defaults are conservative general-purpose values, not a reading of your credit agreement — and your agreement is the only thing your lender will test you against. A leverage ceiling one turn higher than the default turns a red Fail into a comfortable pass, and the reverse is just as possible. Until you have entered the thresholds from your agreement, treat this tab as an illustration rather than a compliance answer, and check the numbers at the top against the covenant section of the agreement itself before you rely on, export, or send anything from it.
EBITDA add-backs
The Covenants table above reports Adjusted EBITDA. The adjustments it adds back are entered on the EBITDA tab of this page — the only editable, money-moving control on the Financial Statements page, so it is worth knowing exactly how it behaves.
The grid is one row per category, twelve month columns, and a Total, with a totals row at the bottom. Positive is an add-back, negative is a deduction. The header says so, and it is the thing people get backwards.
Adding an adjustment
- Click Add Adjustment. A blank row opens at the bottom of the grid. Nothing is written yet — it lives in the page until you save it.
- Type a Category and the monthly amounts. Category is required: Save stays disabled until it has a value.
- Click Save.
After a save the row reopens blank instead of closing, on purpose. The Save button stays where it is so you can enter a second adjustment without hunting for Add Adjustment again. Cancel is how you leave entry mode.
Editing and deleting
- Click any month cell on a saved row to edit it. Each cell saves on its own — there is no separate Save for rows that already exist.
- A Category cannot be renamed once the row is saved. It is editable only while the row is still pending. To change the wording, delete the row and re-enter it.
- Deleting a row deletes that category for the entire fiscal year — all twelve months at once. It asks you to confirm first.
Two things to know before you rely on it
- These adjustments are consolidated-only. There is no entity column and no per-entity split: every consumer of the table sums it by fiscal year alone. If you need an add-back attributed to a single legal entity, this is not yet where to record it.
- On an already-saved row, a note needs at least one non-zero month to stick. A note attaches to the adjustment through the first month carrying an amount, so a note typed onto a saved row whose twelve months are all zero has nothing to attach to and is discarded without a message. Enter the amounts first, then the note. (On a brand-new row this does not apply — the whole row, note included, is written in one go.)
The table is headed EBITDA Adjustments and states its own convention: positive is an ADD-BACK, negative is a DEDUCTION. Get that backwards and adjusted EBITDA inverts — which is the number your covenants are tested against, so it is worth reading the sign before the amount.
Any month cell is editable in place — click it. You do not need a separate form.
Summary breakdowns on this page list a Component against its amount, so you can see which pieces make up a total rather than only the total.
Where the actuals come from
Like the Income Statement, the closed-month columns on the Balance Sheet and Cash Flow are actuals from your ERP General Ledger, while later months are the platform's projection. Your ERP can be an external accounting system, or Arcvue Accounting itself: keep your books in Arcvue's own accounting product and it becomes a selectable ERP source with no separate connection to set up. The projection layered on top is computed the same way regardless of which system supplies the actuals.
The other tabs on this page
Indirect Rates opens on a Rate Summary of fiscal-year rates.
If the monthly trend charts are missing, that is a data state, not a broken tab — the screen says so itself: they appear once monthly actuals are posted. Until then you get the fiscal-year figures only. The three series are Fringe Rate %, Overhead Rate % and G&A Rate %.
Intangibles carries two headline figures — total net book value and annual amortization — over a table of each asset with its GL account, Life (yrs), monthly amortization, Annual Amort and Net Book Value.
Net Book Value is initial value less what has been amortized to date, so it is the figure that ties to the balance sheet; the amortization columns are what gets there.
A Close Review tab appears only if your role holds it. If you do
not see it, you do not have that role — the tab is not missing and nothing is
broken. Ask whoever administers your access rather than reporting a defect.
Close Review — the checks that gate the month
The Close Review tab runs a set of automated checks over the general ledger for one period, and it is what stands between the month and being closed.
Fiscal Year and Month choose the period. Nothing runs on its own — Run Checks is what fetches them, so the tab opens empty and says so.
Pass, Warning, Failure — and only one of them is advice
Each check comes back in one of three states, with a count of each above the list:
| what it means for closing | |
|---|---|
| Pass | nothing to do |
| Warning | you must tick it off before you can close |
| Failure | you cannot close until it is fixed |
A warning is not a note you can carry past the close. Every warning carries an I've reviewed this button, and the month will not close until every one of them shows ✓ Reviewed. The panel above the close button counts what is still outstanding, so if the button is grayed out, read that line — it names either the failures to fix or the number of warnings still to acknowledge.
A check with underlying detail can be expanded to show the accounts behind it.
Acknowledging, then re-running, starts you over
Running the checks again clears every acknowledgment. That is deliberate — a fresh run is fresh evidence, and a tick against last run's findings would be a tick against numbers you have not seen. But it means the natural instinct (acknowledge everything, re-run to be sure, then close) puts you back at the beginning. Run the checks first, then acknowledge, then close.
Who can actually close
Close This Month appears only for the CEO. Everyone else who can open this tab — a CFO reviewing the month, for instance — sees the checks, the counts and the detail, and has no close button. That is the intended split: reviewing the close and finalizing it are different acts.
And there is nothing to close if the checks never ran. The button stays unavailable until a run has returned at least one check, so an empty result cannot be closed past.
What closing does besides closing
Finalizing the period sets the close date, and then does two more things: recomputes the forecast and sends the performance email.
The confirmation tells you whether each one worked, and it is the only place that is said. It reads like "Forecast updated; performance email sent" — or update failed, or not sent. The month is closed either way. So read that message rather than dismissing it: a closed month whose forecast did not recompute is a real state, and nothing else on the screen will mention it.
Exporting the statements to Excel
Export opens a small dialog — Export Financial Statements — rather than downloading immediately, because there are two choices to make first. Cancel closes it without exporting.
The file is one workbook containing all three statements — Income Statement, Balance Sheet and Cash Flow. It is not an export of the tab you happen to be looking at, so there is no need to visit each tab and export it separately.
The two choices
Start year and End year set the range. The list offers six years either side of the current calendar year, and the dialog opens on the year the page is showing.
Granularity decides the shape of the columns, not which years you get:
| what the columns look like | |
|---|---|
| Annual | one column per fiscal year — the dialog notes these carry A / E / F suffixes |
| Monthly | twelve month columns per fiscal year, plus an annual total |
Choosing Monthly does not widen the period — it subdivides the same years. If you want more years, change the range.
It will not let you export a backwards range
If End year is before Start year, the dialog says so and the export button is unavailable. You cannot click past it, so a reversed range cannot produce an empty or surprising workbook.
If the export itself fails, the reason appears in the same place and the dialog stays open with your choices intact.
The file you get
The download is named for what you asked for — the year or year range, and the granularity — so two exports with different settings do not overwrite each other in a downloads folder.
Related pages
- Income Statement — the first tab; its net income feeds retained earnings and cash flow (see the Income Statement guide).
- EBITDA — the add-backs behind Adjusted EBITDA; see EBITDA add-backs above.
- Debt Schedule, Indirect Rates, Intangibles — the remaining tabs on this page. Indirect Rates lists your fringe, overhead and G&A rates by fiscal year; a pool with no rate for a given year shows an em dash rather than 0.0%, because "we have no rate" and "the rate is nothing" are different statements.
- Treasury — where debt instruments (term loans, subordinated debt, the revolver) are configured.
- Scenario Planning — stress-tests covenants under what-if scenarios.
Technical reference
Data model, computation logic, and example SQL (for developers and power users)
The Financial Statements module is primarily computed — the engine reads P&L data, debt schedules, and BS assumptions to project monthly balances through the planning horizon.
Key Tables
balance_sheet
Monthly projected balances for all BS accounts.
| Column | Type | Description |
|---|---|---|
| id | INTEGER | Primary key |
| entity | TEXT | 'CONSOLIDATED' |
| fiscal_year | INTEGER | e.g., 2026 |
| fiscal_month | INTEGER | 1–12 |
| account_code | TEXT | BS account code (GL codes like '11.12.13', NOT simplified like 'CASH') |
| account_name | TEXT | Human-readable name — built into this table, no JOIN needed |
| amount | REAL | Balance at month-end |
| source | TEXT | Source of the balance |
account_hierarchy
Full chart of accounts with hierarchical grouping. Use this for section grouping (Assets/Liabilities/Equity) since there is no bs_structure table.
| Column | Type | Description |
|---|---|---|
| account_key | TEXT | Account identifier |
| account_code | TEXT | GL account code (join key to balance_sheet) |
| description | TEXT | Account description |
| type | TEXT | 'A' (Asset), 'L' (Liability), 'E' (Equity) |
| Level_0 through Level_7 | TEXT | Hierarchy levels with _Code variants |
cash_flow
Monthly Cash Flow Statement line items.
| Column | Type | Description |
|---|---|---|
| id | INTEGER | Primary key |
| entity | TEXT | 'CONSOLIDATED' |
| fiscal_year | INTEGER | e.g., 2026 |
| fiscal_month | INTEGER | 1–12 |
| line_item | TEXT | CFS line item code |
| section | TEXT | 'Operating', 'Investing', 'Financing' |
| amount | REAL | Monthly cash flow amount |
| sort_order | INTEGER | Display ordering |
debt_instruments
Active debt facilities — term loans, subordinated debt, revolver (line of credit).
| Column | Type | Description |
|---|---|---|
| id | INTEGER | Primary key |
| name | TEXT | e.g., 'Senior Term Loan' |
| instrument_type | TEXT | 'term_loan', 'revolver', 'subordinated', 'seller_note', 'earnout' |
| lender | TEXT | Lender name |
| original_principal | REAL | Original principal amount |
| interest_rate | REAL | Annual rate (e.g., 0.08 for 8%) |
| rate_type | TEXT | Rate type (fixed, variable) |
| day_count | TEXT | Day count convention |
| origination_date | TEXT | Disbursement date |
| maturity_date | TEXT | Final payment date |
| facility_limit | REAL | For revolvers — maximum draw |
| is_active | INTEGER | 0 or 1 |
IMPORTANT: Column is name — NOT instrument_name. Column is original_principal — NOT original_amount. There is NO term_months column.
debt_schedule
Monthly amortization schedule computed by the debt engine.
| Column | Type | Description |
|---|---|---|
| id | INTEGER | Primary key |
| instrument_id | INTEGER | FK → debt_instruments.id |
| payment_date | TEXT | Payment date |
| fiscal_year | INTEGER | Year |
| fiscal_month | INTEGER | Month |
| beginning_balance | REAL | Balance at start of month |
| principal_payment | REAL | Monthly principal |
| interest_payment | REAL | Monthly interest |
| ending_balance | REAL | Balance at end of month |
| is_actual | INTEGER | 0 = projected, 1 = actual payment |
debt_amort_rules
Amortization rule changes for step-down schedules.
| Column | Type | Description |
|---|---|---|
| id | INTEGER | Primary key |
| instrument_id | INTEGER | FK → debt_instruments.id |
| effective_date | TEXT | When this rule takes effect |
| monthly_principal | REAL | New monthly principal amount |
covenant_config
Debt covenant thresholds — DSCR and leverage requirements.
| Column | Type | Description |
|---|---|---|
| id | INTEGER | Primary key |
| covenant_name | TEXT | 'DSCR' or 'Leverage' |
| covenant_type | TEXT | Covenant classification |
| threshold | REAL | Minimum DSCR (1.2) or maximum leverage (3.5) |
| measurement_frequency | TEXT | How often measured |
| measurement_month | INTEGER | Month of measurement |
| is_active | INTEGER | 0 or 1 |
| notes | TEXT | Additional details |
IMPORTANT: There is NO warning_buffer or warning_threshold column.
ebitda_adjustments
Add-backs for adjusted EBITDA calculation (bonus, one-time items).
| Column | Type | Description |
|---|---|---|
| id | INTEGER | Primary key |
| category | TEXT | Adjustment category |
| entity | TEXT | 'CONSOLIDATED' |
| fiscal_year | INTEGER | Year the adjustment applies |
| fiscal_month | INTEGER | Month (or NULL for annual) |
| amount | REAL | Add-back amount (positive) |
| notes | TEXT | What the adjustment is for |
bs_assumptions
Driver assumptions for BS projections.
| Column | Type | Description |
|---|---|---|
| id | INTEGER | Primary key |
| param_name | TEXT | e.g., 'DSO', 'DPO', 'MIN_CASH' |
| param_value | REAL | e.g., 45 (days), 30 (days), 150000 ($) |
| description | TEXT | Human-readable explanation |
IMPORTANT: Columns are param_name and param_value — NOT assumption_key and assumption_value.
Key assumptions:
- DSO (Days Sales Outstanding) — drives Accounts Receivable from revenue
- DPO (Days Payable Outstanding) — drives Accounts Payable from costs
- MIN_CASH — Minimum cash threshold; revolver auto-draws when cash falls below this ($150K default)
- LOC limit formula: Configured per tenant (typically a borrowing base formula against AR)
intangible_schedules
Intangible asset amortization — drives D&A on the P&L.
| Column | Type | Description |
|---|---|---|
| id | INTEGER | Primary key |
| asset_name | TEXT | Intangible asset name |
| gl_account_code | TEXT | P&L account for amortization |
| bs_gross_account | TEXT | BS gross asset account |
| bs_accum_account | TEXT | BS accumulated amortization account |
| original_amount | REAL | Original asset value |
| useful_life_months | INTEGER | Amortization period |
| start_date | TEXT | Start date |
| monthly_amort | REAL | Monthly amortization amount |
| is_active | INTEGER | 0 or 1 |
Common Queries
Get Balance Sheet for a specific month
SELECT bs.account_code, bs.account_name, ah.type as section, bs.amount
FROM balance_sheet bs
LEFT JOIN account_hierarchy ah ON bs.account_code = ah.account_code
WHERE bs.entity = 'CONSOLIDATED'
  AND bs.fiscal_year = 2026
  AND bs.fiscal_month = 12
ORDER BY ah.type, bs.account_code;
Get debt schedule for all instruments
SELECT di.name, di.instrument_type,
       ds.fiscal_year, ds.fiscal_month,
       ds.beginning_balance, ds.principal_payment,
       ds.interest_payment, ds.ending_balance
FROM debt_schedule ds
JOIN debt_instruments di ON ds.instrument_id = di.id
ORDER BY di.instrument_type, ds.fiscal_year, ds.fiscal_month;
Get annual interest expense
SELECT fiscal_year, SUM(interest_payment) as total_interest
FROM debt_schedule
GROUP BY fiscal_year
ORDER BY fiscal_year;
Get cash position by month
SELECT fiscal_year, fiscal_month, amount as cash_balance
FROM balance_sheet
WHERE entity = 'CONSOLIDATED'
  AND LOWER(account_name) LIKE '%cash%'
ORDER BY fiscal_year, fiscal_month;
This is a quick look, not the product's cash figure. A name or account-code match sweeps in every balance-sheet line that resembles cash, including brokerage accounts and bank accounts your books no longer carry as active, and one inactive bank account with a negative balance is enough to flip the total's sign. The product's own cash position (behind the covenant warning, Debt and Treasury) reads only the accounts your accounting chart of accounts classifies as cash, and shows no figure rather than a wrong one when that list cannot be read.
Check LOC (revolver) utilization
SELECT ds.fiscal_year, ds.fiscal_month,
       ds.ending_balance as drawn_amount,
       di.facility_limit
FROM debt_schedule ds
JOIN debt_instruments di ON ds.instrument_id = di.id
WHERE di.instrument_type = 'revolver'
ORDER BY ds.fiscal_year, ds.fiscal_month;
Get year-end debt balances by instrument
SELECT di.name, di.instrument_type, di.interest_rate,
       di.maturity_date, ds.ending_balance
FROM debt_schedule ds
JOIN debt_instruments di ON ds.instrument_id = di.id
WHERE ds.fiscal_year = 2026 AND ds.fiscal_month = 12
ORDER BY ds.ending_balance DESC;
Key Computation Logic
Balance Sheet Drivers
- Accounts Receivable = Revenue × (DSO / 30)
- Accounts Payable = Direct Costs × (DPO / 30)
- Accrued Awards = Sawtooth pattern: annual_expense × (month / 12), resets each January
- Accrued Leave = Scales with labor base growth ratios
- PP&E = Prior balance − monthly D&A
- Retained Earnings = Prior RE + monthly net income
- Cash = Plug — balances the BS after all other items
LOC (Revolver) Auto-Management
The revolver auto-draws when cash would fall below MIN_CASH and auto-pays down when cash exceeds the threshold. LOC limit is configured per tenant (typically a borrowing base formula). Float logic allows over-cap draws with a Dashboard warning.
Covenant Calculations
- DSCR = (EBITDA + add-backs) / Total Debt Service. Must be ≥ 1.2x.
- Leverage = Total Debt / Adjusted EBITDA. Must be ≤ 3.5x.
- Traffic lights: 🟢 above threshold + buffer, 🟡 between threshold and buffer, 🔴 below threshold.
Relationships to Other Modules
- Income Statement → Net income feeds retained earnings rollforward and cash flow from operations
- Indirect Rates → D&A schedule items write to
pl_forecasts(source='da_schedule') - Scenario Planning → Covenant recalculation per scenario with stress testing
- M&A Module → M&A deals trigger "wipe and replace" of debt instruments + schedule
- Reporting → Board tab shows covenant traffic lights; CEO/CFO tab shows full liquidity detail
- Dashboard → Compute All step 5 runs the three-statement engine
When a panel cannot load
An empty panel and a failed panel mean opposite things, and the Financials tabs keep them apart.
A tab whose data never arrived says so, and offers Retry. You will see this on Covenants, Debt, Indirect Rates and EBITDA -- where the headline, the bridge table and the adjustments grid each report their own request, so a failed grid stays empty rather than inviting you to re-enter adjustments that are already on file. Retry re-runs only that tab's request; nothing you have entered elsewhere on the screen is affected.
An empty state is a statement about your book, not about the request. No covenant data means the request came back and no covenants are configured.
No debt instruments means there are none on file. Those are facts to act on.
The two remedies are opposite: a panel that failed is retried, an empty one is filled. Nothing on a failed tab sends you to another module -- if the request did not complete, this page cannot tell you what is configured anywhere.