Value Builder — M&A Exit-Readiness Diagnostic
Every owner eventually asks some version of the same question: if I went to market, what would a buyer see? Value Builder answers it. It looks at your business the way an acquirer's diligence team would — through ten drivers of enterprise value — scores each one, rolls them into a single exit-readiness score, and explains, in plain language, what each score signals to the buyer pool.
It is deliberately diagnostic, not prescriptive. Value Builder tells you what a buyer will see; it never tells you what to do about it. The narratives are written from the buyer's perspective and framed as information, not instruction — the decisions stay yours.
Who uses it: the CEO and finance leadership thinking about exit, recapitalization, or simply running the company as a more valuable asset. It's a feature-gated module — if you don't see it, it isn't enabled for your tenant.
Finding it
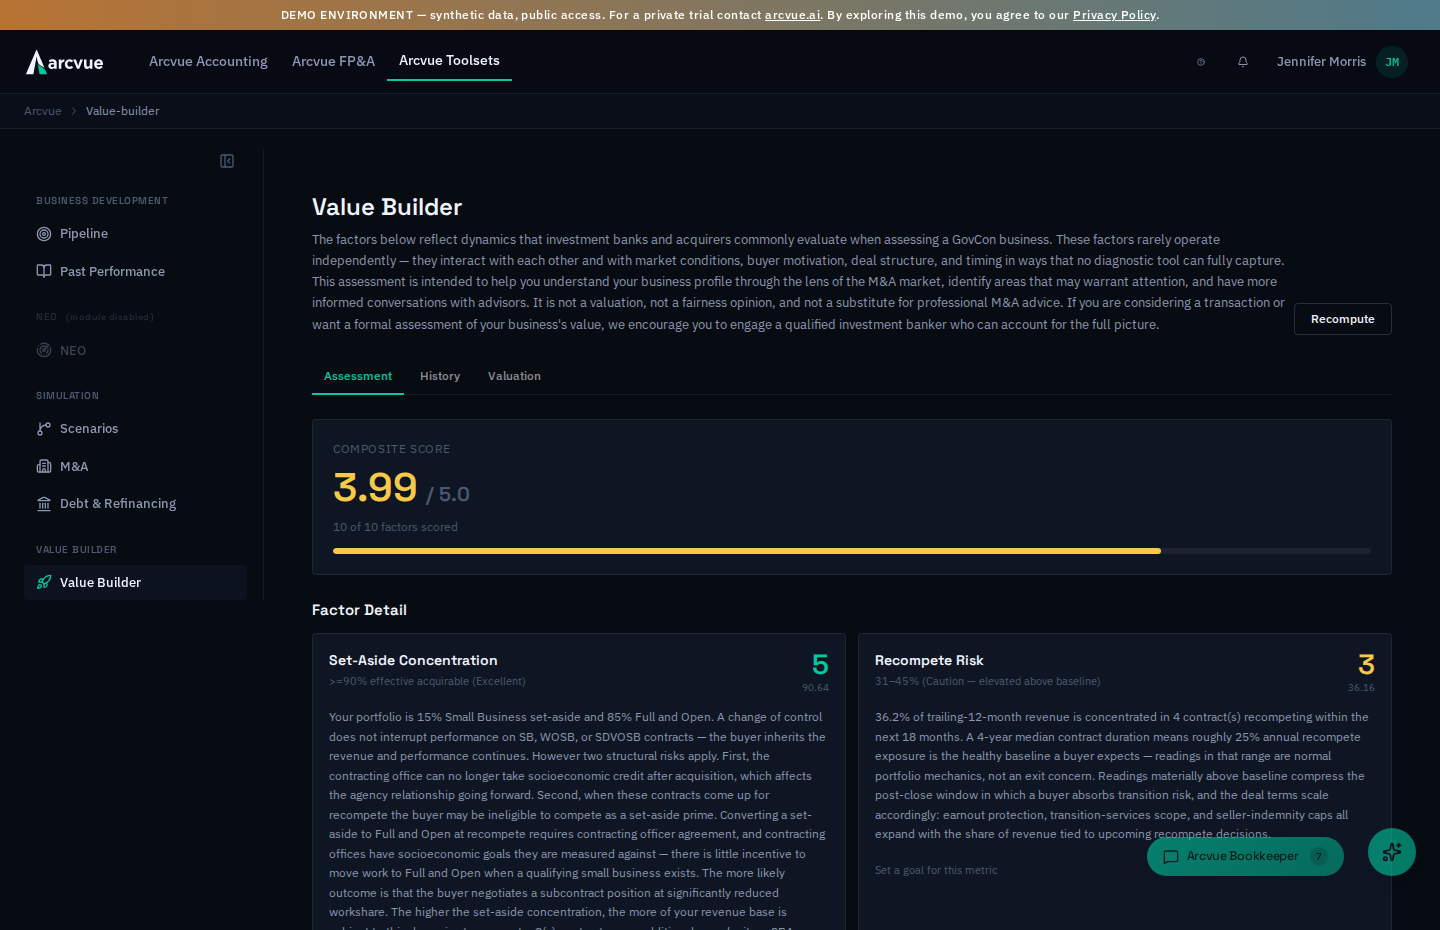
Toolsets → Simulation → Value Builder (the rocket icon). If the item isn't in your nav, the module isn't turned on for your tenant (an admin enables it). Inside, there are up to three tabs: Assessment, History, and Valuation (the last is permission-gated — see Roles, below, and it may not appear for you).
How to read it
Two ideas frame everything here.
Ten drivers, one score. Value Builder scores ten value drivers on a 1–5 scale and blends them into a composite exit-readiness score (also 0–5). The composite renormalizes over whatever is scored — a driver that can't be scored yet simply doesn't drag the average — so you always get an honest read on what's known.
Pro-forma, on real numbers. Every score runs against your trailing-twelve-month actuals and your current contract portfolio — not projections. It's a snapshot of the business as it actually stands today, which is exactly what a buyer underwrites.
Assessment
The main tab. At the top, the composite score with its progress toward a perfect 5 and a count of how many drivers are scored. Below it, two risk cards that surface independently of the composite — because they're the kind of thing a buyer flags no matter how strong the rest of the picture is:
- OCI Exposure — when a meaningful share of revenue comes from advisory / SETA work that creates organizational-conflict-of-interest constraints. Each such contract can remove a category of otherwise-natural acquirers.
- Set-Aside (8(a)) Concentration — when a meaningful share of revenue sits on 8(a) contracts, which carry categorical post-acquisition termination risk and a narrow acquirer pool.
Then the ten driver cards. Each shows its score, the band it falls in, the underlying number behind it, and a short diagnostic narrative explaining what that score means to a buyer. Where you've set a goal for a driver, the card tracks it inline.
The ten value drivers
- Set-Aside Concentration — how much of your revenue transfers cleanly to a buyer, weighting each set-aside type by the risk it carries.
- Recompete Risk — the share of revenue up for recompete inside the near-term window (a compressed post-close window is what buyers watch for).
- Prime / Sub Mix — how much revenue you hold as prime, where the customer relationship is yours to transfer.
- Contract Concentration — how much rides on your single largest contract.
- Customer Desirability — the mix of agencies you serve, weighted by how attractive each is to the buyer market.
- Capability Premium — where your work sits on the spectrum from commodity staffing to differentiated capability.
- Revenue Trajectory — your recent year-over-year growth.
- EBITDA Margin — adjusted EBITDA as a share of revenue.
- Addback Quality — how much of your adjusted EBITDA depends on non-recurring addbacks (buyers discount aggressive addbacks).
- Management Depth — how well the business runs without the CEO, from a short five-question self-assessment.
Management self-assessment
Driver 10 is the one thing the engine can't read from your data, so it asks: five yes/no questions about your leadership bench — a named BD lead, an operations lead, a finance lead, recent non-CEO-led wins, and whether the business would run if you stepped away for a quarter. It takes about a minute, scores immediately, and the composite updates on the spot.
Below the drivers, Factor Detail breaks each one out into its own card with the reasoning behind the score, so you can see why a driver landed where it did rather than only what it scored.
The management block is headed Management Assessment and carries an Update answers link. Re-answering does not overwrite history — each submission becomes a new dated assessment, which is what makes the History tab meaningful.
History
Once you have more than one assessment on file, the History tab charts your composite over time and lists every snapshot with its per-driver scores and any risk flags that were active then. If you have at least a year of actuals and a fully-described contract portfolio, Value Builder can backfill history — reconstructing past snapshots at quarterly intervals over the prior two years — so you can see the trajectory without having waited to accumulate it.
Each row is one assessment, and the columns are:
| Column | What it holds |
|---|---|
| Trigger | What caused this snapshot to be taken. |
| Composite | The overall score at that moment. |
| Warnings | Whether an organizational-conflict-of-interest flag was active. |
The ten driver scores appear as their own columns under abbreviated headings — Cust Desir for customer desirability, Rev Traj for revenue trajectory, Mgmt Depth for management depth, and so on. The abbreviations exist so ten scores fit on one row without scrolling; they are the same drivers named in full on the Assessment tab.
Backfill history appears when there is nothing to show yet. It computes assessments from data you already have, so the trend line starts populated rather than from today.
Classifications
Agency tiers are corrected on a different page: Admin → Agency Tiers. An LLM classifies each agency as coveted, neutral or non-coveted, and that tier feeds Customer Desirability scoring here. Set tier records a person's override and reads Saving… while it writes.
An override locks the model out of that agency permanently. The classifier will not revisit it, so this is not a nudge the model later reconsiders. Press it when you mean to settle that agency for good.
The tier saves immediately; the score does not. Nothing recomputes on a timer, so the desirability figures on this page keep their old values until you run the assessment recompute.
Emptying a box does not clear a stored value — a blank parent agency or note keeps what is already there. To change one, type the new value.
This is where a person corrects the model. Arcvue classifies every contract's service tier and raises conflict-of-interest flags automatically. Until this tab existed the product showed you both and let you change neither — you could see a misclassified contract and had no way to say so.
The tab lists the classifications with their confidence and lets you settle them. A human decision is recorded as a human decision, so an acquirer's diligence team can see which tiers the model assigned and which a person confirmed — and the score stops re-deriving the ones you have settled.
Work the low-confidence rows first. They are the ones where the model is least sure and where a correction changes the most.
What each column is telling you
| Column | What it says |
|---|---|
| Contract | the contract being classified. Every active contract appears here once its award has been accepted in the review queue |
| NAICS | the federal industry code on the contract. Read-only on this tab — the model leans on it to pick the tier, so a wrong NAICS is the usual explanation for a wrong tier, and you correct it on the contract record |
| Service tier | High (work an acquirer pays up for), Neutral (neither helps nor hurts the multiple) or Low (commodity work that drags it) |
| Decided by | the column this screen exists for — the model, with the confidence it reported, or the person who overrode it |
| OCI | the FAR 9.5 flag, and whether a person has ruled on it or the model has only raised it |
Rows the model is least sure about sort to the top and are tinted, so the tab opens on the work rather than on an alphabetical list.
Correcting a tier, and ruling on a conflict
Changing anything here is limited to the CEO, an administrator or the finance lead. Everyone else sees the same rows and is told plainly that the controls are not theirs. The button on the row reads Correct when the model set the tier, Change when a person already has, and Close while the panel is open.
The panel has two halves and two saves. Set service tier writes the tier. Confirm conflict / Record no conflict writes the OCI ruling. They are separate saves, and saving either one closes the row — so if you change the tier and rule on the flag in the same visit, press both buttons. Press one and the other half is gone with no warning.
Set service tier stays grayed out until two things are true: the tier you have picked differs from the one already on the row, and you have filled in Why you are changing it. Neither is a formality. There is no way to confirm a tier you agree with — agreeing with the model records nothing, and the row keeps the model's confidence. And a blank reason is not the quick path; it is a blocked one.
Your answer is then stored as certain, recorded with your name and the date. That is the whole reason a reason is required: an assertion of certainty with nothing behind it is an audit trail in name only.
Either OCI answer is a ruling. Conflict exists and No conflict are both decisions recorded against your name — clearing a flag the model raised is a decision, not a dismissal — and afterwards the row reads ruled by a person rather than model flagged.
What kind appears only once you have chosen Conflict exists: impaired objectivity, unequal access to information, biased ground rules, in your own words. Note for a buyer's diligence (optional) travels with the flag into diligence — a mitigation in place, a firewall, a waiver on file. Leave it empty unless the bare flag would mislead someone reading it cold.
Neither OCI field is required, so Record no conflict is a single click.
Valuation
The Valuation tab (when you have access to it) translates the composite into a market read: an implied range of adjusted-EBITDA multiple, and from that an implied enterprise-value range. A stronger composite maps to a higher multiple band; the range is then shaped by your scale — very small firms may not command a broad-market multiple at all, while larger firms pick up scarcity and scale effects. Each band comes with a diagnostic note on what it means in a real deal (for example, where an earnout or seller note tends to enter the conversation) and a standing disclaimer that this is a directional diagnostic, not an appraisal or an offer.
Goals
You can set a target on any driver — a score you're steering toward, an optional date, and a note on where the target came from (your own read, an investment-banker conversation, an advisor's input). Value Builder then tracks the current value against your target on every recompute. It never proposes targets for you and never judges your pace — goals are yours to set and yours to move.
Any driver card carries a Set a goal for this metric link. It opens a small form:
| Field | What it does |
|---|---|
| Target score (1–5) | Where you intend that driver to land. |
| Target date (optional) | When you intend to get there. Optional — a goal with no date is still a goal. |
| Goal source | Where the target came from: Internal target, Investment-bank feedback, an advisor recommendation, or another source. |
| Rationale (optional) | Why this number. |
Set goal records it; Cancel closes the form without saving.
Goal source is the field that matters at exit. A target you set
yourself and a target an investment bank told you to hit are different kinds of
claim, and a diligence process will ask which it was. Recording the source at
the time you set the goal is the only moment that answer is cheap — a year
later nobody remembers.
Where the numbers come from
- Financials (Revenue Trajectory, EBITDA Margin, Addback Quality) come from your trailing-twelve-month actuals, with adjusted EBITDA built from your addbacks.
- Portfolio drivers (Set-Aside, Recompete, Prime/Sub, Concentration, Customer Desirability) come from your contract records — set-aside type, prime/sub position, recompete timing, and revenue by agency.
- Agency desirability and capability tier are classified for you: each agency is scored coveted, neutral or non-coveted by an automated classifier, as are service tier and OCI exposure. Human override is available on both OCI and agency tier — see Overriding an agency tier below.
- Management Depth comes from your own five-question self-assessment.
A driver that can't yet be scored confidently — say, a capability classification below the confidence threshold — stays blank rather than guessing, and the composite simply scores over the rest.
Overriding an agency tier
When the classifier has an agency wrong — and you are the one who knows the customer — an administrator can set its tier by hand under Admin → Agency Tiers. Your setting wins over the classifier from that point on.
The list shows, for each agency, Decided by — whether the model set the tier (with the confidence it reported) or a person settled it. The rows nobody has settled are the ones worth your time, because those are the ones still moving. Parent shows the department a component agency rolls up to; blank means a top-level department, and it affects only how agencies group in scoring. You can change it on the row.
An override locks the classifier out of that agency permanently. It does not expire and the model will not revisit that agency later, so this is a standing decision rather than a correction the system will revisit next quarter. Set it when you are confident the classifier is wrong about a customer you know well; leave it alone when you merely disagree with a score this quarter.
The tier list carries a Parent department field: the department a component agency rolls up to. Leave it blank for a top-level department, and note that emptying the box does not clear a stored value — type over it to change it.
Tiers run from coveted through neutral to Not coveted, meaning work an acquirer discounts. The rightmost column of the table has no visible heading; it holds the per-row controls and is announced to screen readers as Row actions.
Roles
Everyone with access can view the Assessment and History. Recomputing, setting goals, and submitting the management self-assessment are reserved for the CEO, finance lead, and admin. The Valuation tab — the one that shows dollar figures and multiples — is more tightly held: it's visible only to those leadership roles, and only when your tenant has enabled the implied-multiple view. Everyone else works from the drivers and the composite without the valuation math.
Troubleshooting
- Value Builder isn't in my nav. It's a feature-gated module; an admin enables it per tenant.
- A driver shows a dash instead of a score. It isn't scored yet — either the data needed isn't present, or an automated classification came back below its confidence threshold. The composite scores over the drivers that are available.
- I don't see the Valuation tab. Either your role doesn't include valuation access, or the implied-multiple view isn't enabled for your tenant. The rest of Value Builder works without it.
- History is empty. You need at least a year of actuals (and a described contract portfolio) before history can be built; if you're eligible, use the backfill option to reconstruct it.
Related pages
- M&A Modeling — when the diagnostic turns into an actual deal, this is where you model it.
- Scenarios — stress-test how strategic moves change the financial picture that feeds these drivers.
- Financial Statements — the P&L and adjusted-EBITDA detail that the financial drivers are computed from.
Working with the tables
The assessment history is a sortable grid with a frozen header row and one-click export to Excel.