New Business Pipeline
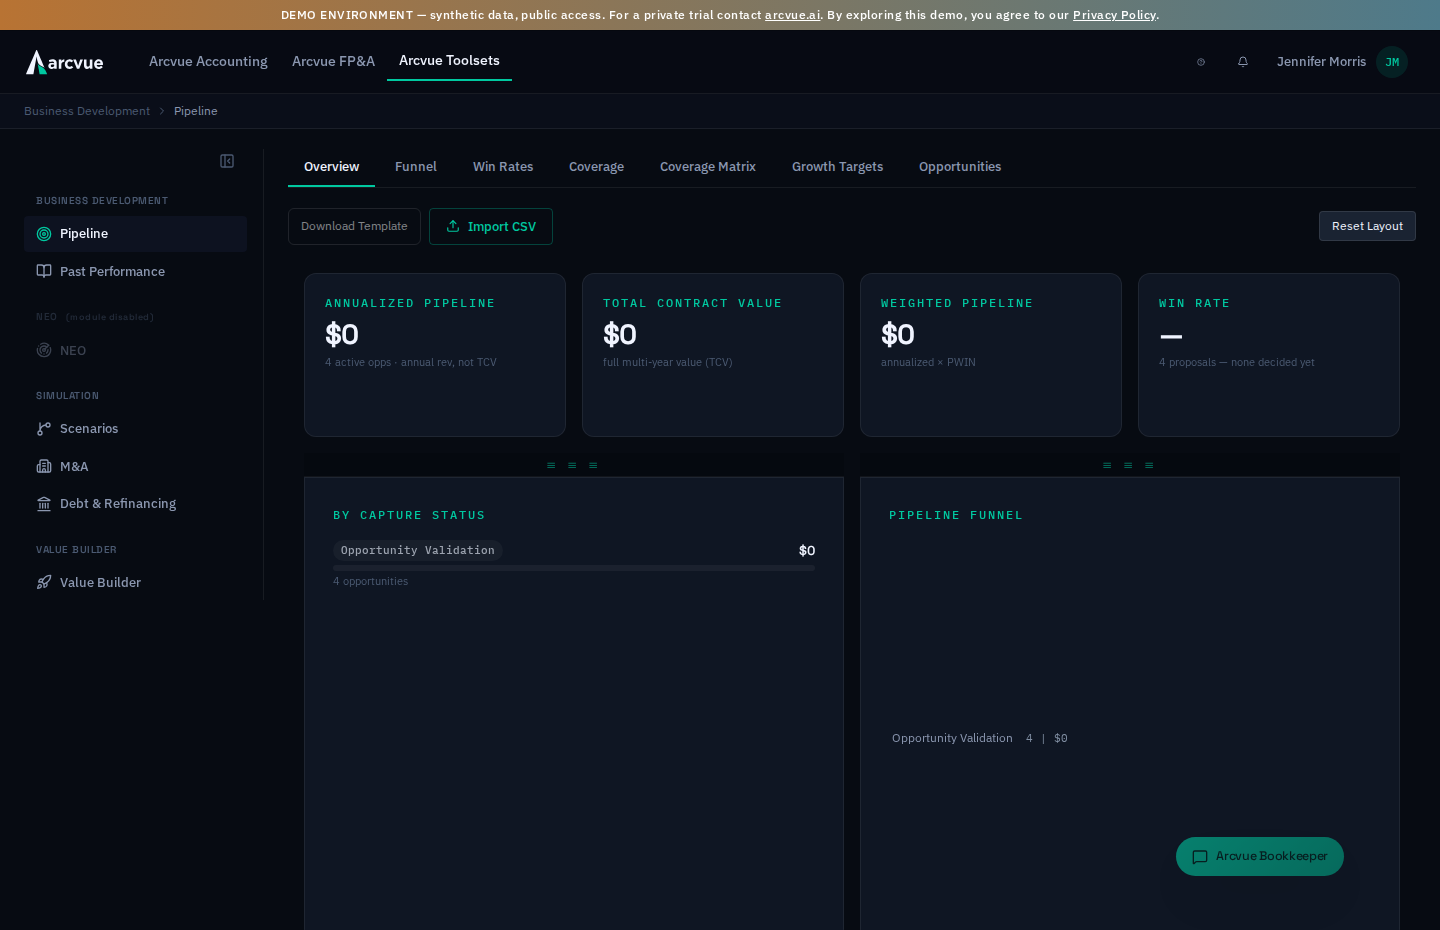
The Pipeline module tracks every opportunity from early capture through award, measures how well your pipeline covers your growth targets, analyzes win rates, and pushes revenue targets into the forecast. It is the home for business-development analysis — the numbers a CGO or capture lead reviews to answer "do we have enough in the pipeline to hit the plan?"
Where it lives
In the left nav, open Toolsets → Business Development → Pipeline.
Pipeline moved under Toolsets when Arcvue Accounting shipped. The surface area is identical to the old FP&A pipeline — it now lives beside the other BD and simulation tools rather than under FP&A.
The page opens on a tab bar with seven views. Click any tab to switch; the active tab carries a teal underline:
| Tab | What it answers |
|---|---|
| Overview | Headline pipeline value, capture-status mix, funnel, and breakdowns |
| Funnel | Value and aging at each funnel stage |
| Win Rates | Historical win rate by division, contract type, and vehicle |
| Coverage | Pipeline value vs. growth target, by division |
| Coverage Matrix | Multi-year coverage with stage-delay timing assumptions |
| Opportunities | The searchable, filterable opportunity list |
Getting your pipeline data in
Pipeline data comes from a CRM export, imported on the Overview tab.
- On Overview, click
Download Templateto getPipeline_Import_Template.xlsx— the expected column layout. - Fill it from your CRM (or match the columns in your own export).
- Click
Import CSVand choose the file, or drag the file onto the import area (it accepts.csv,.xlsx, and.xls). - A toast confirms the result:
Imported N opportunities, updated M. Re-importing updates existing opportunities rather than duplicating them.
If no data has been imported yet, tabs show an empty state (for example, "No pipeline data — Upload your pipeline CSV or connect your CRM to populate pipeline opportunities.").
A tab that says its data could not be loaded — "Pipeline data could not be loaded", or the same for the coverage, breakdown or coverage matrix views — is saying something different: the request did not complete, so the tab makes no claim about what your pipeline holds. Reload the page rather than importing again; an import does not fix a request that failed.
Overview
Four KPI cards head the tab. Click any card to jump to the matching detail view:
Annualized Pipeline— total annual revenue across active opportunities (annual run-rate, not total contract value). Opens the Opportunities list.Total Contract Value— full multi-year value (TCV) of the same opportunities.Weighted Pipeline— annualized value multiplied by each opportunity's PWIN. Opens Coverage. An opportunity with no PWIN entered contributes nothing here; Arcvue does not assume a probability on your behalf, so a blank counts as zero rather than as a default.Win Rate— won proposals as a share of decided proposals. Opens Win Rates. Shows a dash until at least one proposal is decided.
Proposals whose Price Type in Pricing is Support / Informal — priced for another firm to submit, or exercises that never went out — are excluded from Total Pipeline Value, the win-rate tiles and breakdowns, and the won-business revenue that feeds the forecast. They are still in Pricing; they are simply not your company's dollars.
Below the KPIs are three draggable widgets:
- By Capture Status — annual revenue per capture status (Capture, Qualify, Propose, Awarded, and so on), with a bar per status. Click a status to open the Opportunities list filtered to it.
- Pipeline Funnel — a horizontal funnel of value by stage.
- Pipeline Breakdown — switch the dimension with the pills (By Division, By Contract Type, By Customer, By Vehicle, By Incumbent, By Stage). Each tile shows value in millions and opportunity count; click a tile to open the filtered Opportunities list.
Drag any widget by its handle to rearrange the grid; the layout saves automatically. Reset Layout restores the default arrangement.
Vehicle spellings (By Vehicle view)
Vehicle names arrive from the CRM as free text, so one vehicle can show up under several spellings. On the By Vehicle breakdown an administrator sees Review spellings in the card header; when the nightly pass has proposed roll-ups, the button shows how many are waiting. It opens the Vehicle spellings drawer:
- Each proposed roll-up shows the raw spelling and, under
Rolls up to, the vehicle it would roll up into -- edit that name if the proposal is wrong.Confirmrecords the roll-up; the breakdown, the vehicle filter and NEO honor it from then on. Keep as its own vehiclerecords that the spelling is a vehicle in its own right, not an alias. Nothing is deleted, and the nightly pass stops proposing that match.Add mappingrecords a roll-up the pass has not proposed: type the raw spelling underSpellingand the vehicle it belongs to underRolls up to. A spelling that already has a mapping is refused; confirm or edit the existing one instead.- The drawer is in two halves.
Needs reviewholds what the nightly pass has proposed and nobody has ruled on yet;Add a mapping by handis where you enter a spelling the pass has never seen. An emptyNeeds reviewsays which of two different things it means — "Spellings appear here after the nightly pass has run" when nothing has been harvested at all, versus "Every spelling on file has been confirmed" when the queue is genuinely worked off. Those are opposite situations and the wording is how you tell them apart. - Only confirmed and seeded roll-ups change the numbers. A proposal that is still waiting does not move the breakdown. If the list fails to load,
Retryreloads it.
Funnel
A dedicated, larger funnel chart plus a summary card per stage. Each card shows the stage's opportunity count, total value, and average days in stage — colored green under 90 days, amber under 180, red beyond. Click a card to open the Opportunities list filtered to that funnel stage.
Win Rates
Year sits above the cards and governs the whole tab — every card and every view below them, not just one table. It opens on All time; picking a year narrows all four cards and every breakdown to bids whose response date falls in it. Only years that actually carry decided bids are offered, and the list keeps showing all of them once a year is selected, so there is always a way back.
Four cards head the tab and describe the decided book for whichever year is selected — all of it, on All time:
- Win Rate — bids won as a share of bids decided.
- Dollar Win Rate — value won as a share of value decided. This is a different answer, not the same one rounded twice. Winning many small bids and losing the large ones puts these far apart, and reading the count alone hides it. The card names how many decided bids carry a recorded value, because the rate is computed over those and not over all of them.
- Offered Price Difference — on the bids we LOST where both our price and the winning price are known, how our pricing compared in aggregate. The sign is the point. Above the winners means we were priced out; below them means we lost on something other than price, which is a different problem and calls for a different fix. Sub and JV bids are excluded: a sub prices a slice of another firm's proposal, so comparing it against a whole award would not be a statement about our pricing at all.
- Median Price Difference — the same comparison on the MIDDLE lost bid rather than in aggregate. The card beside it is dollar-weighted, so one very large bid can carry it; this one says what an ordinary loss looked like. Read them as a pair. Agreement means pricing behaves the same way across the book; disagreement means one part of it does not, and which number is the "real" one depends on the question being asked. They also measure against different bases: the card beside it asks how far above the WINNERS' price we came in, this one asks what share of OUR OWN bid the gap was. This one excludes sub bids and keeps JV bids — a narrower exclusion than the card beside it, and transcribed from the reporting model rather than tidied to match.
Each card carries a trend line beneath it showing how that measure has moved year to year. The line always spans every year, even while a single year is selected, so a filtered figure can still be read against the years around it. A break in the line is a year the measure genuinely has no value for — a year with no lost bid carrying both prices has no price difference, and the line stops rather than drawing a zero, which would claim we priced level with the winners. A measure with fewer than two years of history draws no line at all, because a single point says nothing about direction.
Analyze historical outcomes with the pill selector:
- By Year — win rate per year as a trend line, not a ranking. This is the only view that answers which way the rate is moving, so it is ordered chronologically however few bids a year carries.
- By Division — win rate per division, with a bar chart and a table (Total Pursued, Won, Lost, Win Rate, Avg Won Deal, Avg Lost Deal).
- By Agency — the same by customer agency.
- By Entity — the same by the entity that bid, when more than one entity bids under this tenant.
- Prime vs Sub — the same by the position taken on the bid.
- New vs Recompete — new work against renewals, carrying BOTH the win rate and the dollar win rate side by side, since the two rarely agree and the gap between them is the finding. Bids with no work type recorded appear as Not classified rather than being dropped.
- By Contract Type — the same broken out by contract type (FFP, T&M, CPFF, and so on).
- By Vehicle — the same by contract vehicle, with total value won.
A cut only describes the bids that record the field. Every row carries its own Total Pursued, so compare that against the decided-bid total before reading a rate as the firm's rate. Where a field is recorded on only part of the book, the bids carrying it are rarely a random sample of it -- a position or set-aside captured on some pursuits and not others usually reflects which pursuits someone worked up in detail, and that is exactly the kind of bid whose outcome differs.
A view says no such field recorded when this tenant does not carry that field at all, and no decided bids carry a value when it does and none of the decided bids has one filled in. They are different problems: the first is nothing you can fix from the screen, the second is filled in by recording the field on the pursuits that are missing it.
Win rates populate as proposals are marked Won or Lost in the Pricing module. Until deals are decided, this tab shows pipeline distribution and a banner noting there are no completed outcomes yet.
Win probability coverage
An opportunity in the late acquisition stages — RFP Open and Source
Selection — should carry a win probability. When any of them does not, a
Late-stage pursuits with no win probability card appears at the top of the
Overview tab, above the draggable widgets. It shows the count and total
value, then groups the pursuits by capture owner, largest value first, with each
pursuit listed inline so the owner can act without a second lookup.
A blank PWIN on earlier-stage work is correct and is deliberately not counted here. Scoring every opportunity regardless of maturity is what makes a pipeline unbelievable, and a card that flagged all of them would be noise.
The card is absent — rather than showing an all-clear it has not earned — on a tenant whose opportunities do not come from NEO. When every late-stage pursuit is scored it reads Every late-stage pursuit has a win probability entered.
Coverage
Coverage answers whether the pipeline is large enough to hit the growth target. Four KPIs sit up top:
Revenue Target— the new-business revenue target for the fiscal year.Pipeline Value— total unweighted pipeline.Coverage Ratio— unweighted pipeline divided by the new-business growth target.Weighted Coverage— the same, multiplied by PWIN. As above, an unscored opportunity contributes zero, so a low weighted figure can mean unscored rather than unlikely — which is what the card below tells you.
The division table breaks this down per division (Revenue Target, Pipeline Value, Coverage, Weighted Cov., Recompete, New Business, Opps) with a Company Total row. Coverage cells are color-coded by health:
- Green — 3.0x or higher (Healthy)
- Amber — 2.0x to 3.0x (Adequate)
- Red — under 2.0x (At Risk)
Push Targets to Forecast writes these growth targets into the monthly forecast allocations.
Push Targets overwrites the monthly forecast allocations for the current fiscal year. It asks first: the confirm bar states the year it will overwrite, Yes, Push runs it and Cancel backs out. The warning names the fiscal year for a reason — read it before confirming, because the overwrite is not scoped to the divisions you happen to be filtered to.
Coverage Matrix
The matrix projects coverage across multiple fiscal years using timing assumptions. Set how long, in months, opportunities in each stage take to convert to revenue under Stage Delay Assumptions (identified, qualifying, pursuing, proposing — 0 to 36 months each). The table then shows Pipeline value and Coverage for every division across each fiscal year, with a Company Total row. Matrix cells use the same health thresholds as the single-year view — green at 3.0x or higher, amber 2.0x to 3.0x, red under 2.0x — which is what the legend beneath the matrix states.
Division rows group on one identity however a pursuit was labeled — a NEO routing label, a growth-target name, or a spelling variant all land on the same row, and unrouted pursuits gather under a single Unassigned row. A muted no target chip means no growth target is set for that division and year, so there is no ratio to compute — set one under FP&A > Forecast > Growth Targets. A red 0.0x is the different, real warning: a target with no pipeline against it.
Growth Targets — moved to FP&A > Forecast
Growth Targets is no longer a Pipeline tab. It now sits in FP&A > Forecast, immediately before Pipeline Forecast, because setting the target and building the forecast that has to meet it are the same job. Coverage on this page still measures against those targets — see Contract Forecasting for how to set them.
Opportunities
The full opportunity list, with search, filters, and inline editing.
- Search by name; filter by division and capture status.
Active Onlyhides awarded/closed opportunities; toggle it to show all.Show Excludedreveals opportunities that have been excluded from the forecast.Exportdownloads the current filtered list asarcvue-pipeline.xlsx.- Clicking a breakdown, funnel, or capture-status element elsewhere brings you here with a filter chip already applied; clear chips individually or with Clear all.
The filter rail sits above the list. All Divisions and All Statuses are the unset states of the two dropdowns — no filter, rather than every value selected.
And All Statuses is also the label on the toggle beside that dropdown, which is a different control. That single button reports the state you are in, not the click you are about to make: it reads All Statuses while awarded and closed work is included, and Active Only once it is excluded. So if you are looking for Active Only and cannot find it, you are looking at it — it currently says All Statuses.
Changing any filter returns you to page 1. The list pages with Previous and Next either side of a page / total counter, and each button grays out at its end of the range.
The table sorts by Opportunity, Annual Revenue, Company Value, Pwin, and Award Date (click a header). Each row shows Division, Status, Annual Revenue, Company Value, Pwin, Award Date, Age (an Overdue badge appears when the award date has passed and the deal is still open), Type (New or Recompete), and Incumbent.
- Edit a row: hover any row and a pencil appears beside its Division. It opens
Edit division and pwin, which turns two cells into inputs in place:Divisionbecomes a dropdown of your divisions — a free-text box if this tenant has none — andPwin percentbecomes a 0–100 number box.Save division and pwin(the check) writes both at once;Cancel edit(the cross) discards them and leaves the row as it was. Choosing the blank Division option clears the override, and the row falls back to the division the import supplied. If the write fails the row says Not saved. Try again. and keeps what you typed, so nothing is lost to a dropped connection. - Exclude from forecast: the eye in the Forecast column.
Exclude from forecastdrops the opportunity out of coverage and forecast math; the same control then readsInclude in forecastand puts it back. It is the counterpart toShow Excludedin the filter rail — that reveals excluded rows, this is what makes a row excluded in the first place. A failed toggle says Not changed. beside the control rather than leaving the eye in its old state with nothing said. - Open the drawer: click a row to see full detail — Division, Status, Annual Revenue, Company Value, Pwin, Contract Type, Award Date, Type, Incumbent, Customer, Agency, NAICS, and description. When the opportunity is linked to a priced proposal, the drawer also shows the linked proposal — its name, status, priced revenue, and gross margin — so you can compare the captured pipeline value against what Pricing actually scoped.
How Pipeline connects to the rest of Arcvue
- Growth Targets → Coverage: coverage ratios are pipeline value divided by the growth targets, which are set in FP&A > Forecast > Growth Targets.
- Coverage → Forecast: Push Targets to Forecast writes monthly new-business allocations that flow into the Cockpit tab of Forecast.
- Pricing → Win Rates: proposals decided in Pricing (Won/Lost) feed the win-rate history.