How to View and Manage Indirect Pool Rates
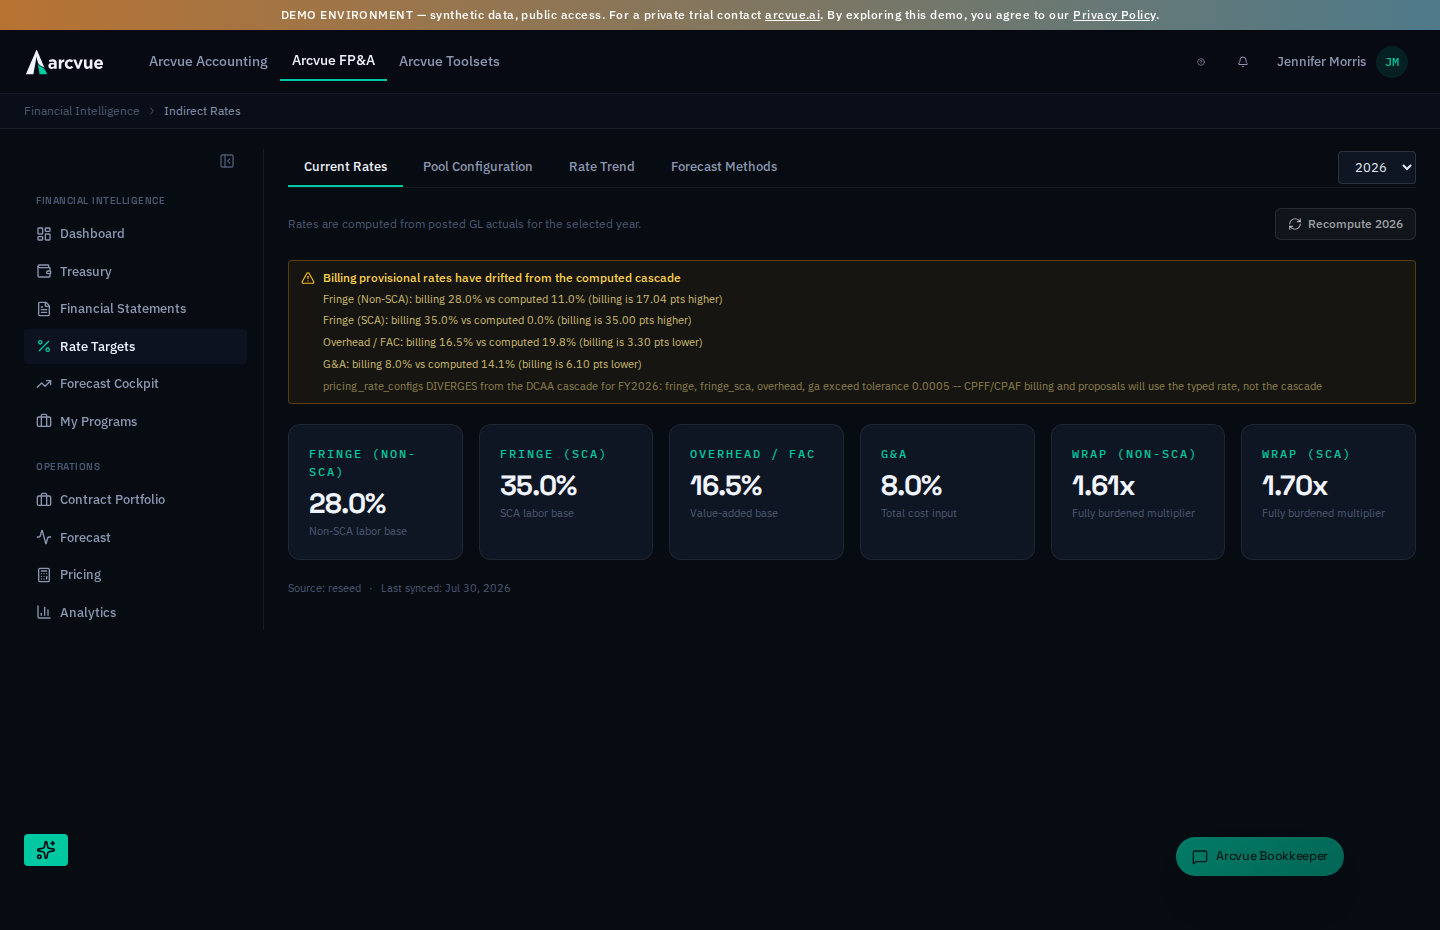
Rate Targets gives you a real-time view of your indirect cost pool rates, their monthly accumulation, and historical trends. Use this to forecast labor burden, validate cost allocations, and understand how each pool (Fringe, Overhead, G&A) cascades through your cost structure.
Navigating to Rate Targets
- In the left nav, open FP&A → Financial Intelligence → Rate Targets.
- The page displays four tabs:
Current Rates,Pool Configuration,Rate Trend, andForecast Methods. - Forecast Methods shows how each indirect GL account is projected forward, grouped by tier — tiers run in order, so an account's tier decides when its method is applied. Methods are configured per GL account and fiscal year, and the tab reads No forecast methods for <year> until they are. The three walkthroughs below cover the first three tabs; this one is named here so you know it exists rather than discovering it by accident.
- The page displays four tabs:
Tab 1: Current Rates
This tab shows your organization's active indirect rates for the selected year.
Viewing summary rates
- In the top right, if multiple years are available, use the year selector dropdown to choose your target fiscal year.
- Six KPI cards display headline metrics:
Fringe (Non-SCA)— burden rate applied to non-SCA-flagged laborFringe (SCA)— burden rate for Service Contract Act laborOverhead / FAC— overhead pool rate, typically applied to value-added baseG&A— general & administrative pool rate on total cost inputWrap (Non-SCA)— fully burdened multiplier for non-SCA labor (e.g., 2.5x)Wrap (SCA)— fully burdened multiplier for SCA labor (e.g., 2.8x)
If no rates appear, the Indirect rates not configured empty state indicates rates must be set up in Admin.
Above the cards, a line says the rates are computed from posted GL actuals for the selected year. Recompute [year] rebuilds them now as a background job; the line then reads Recompute started — rates refresh when the job completes.
Two amber warnings can also appear on this tab: one when your billing rates have drifted from the computed rates, one when billing and incurred-cost rates do not rest on the same source. The section When the billing rates and the computed rates disagree in the Rate Targets guide explains both, and what it means when the check itself could not run.
Reviewing pool-level rates
- Scroll below the KPI cards. If your organization uses pool-based configuration, a
Pool-Level Ratestable appears. - The table shows four columns:
Pool— the pool name (e.g., "Fringe — Non-SCA", "Overhead")Rate— the current rate as a percentageBase— the allocation base (e.g., "Direct Labor", "Value Added")Source— where the rate came from (e.g., "onboarding", prior accounting system sync)
- Click any column header to sort the table. Use the
Exportbutton in the table header to download it as a branded Excel workbook. - At the bottom, note the source metadata:
Source:indicates the originating systemLast synced:shows when the rate was last pulled from your accounting system
Tab 2: Pool Configuration
This tab reveals the structure of your indirect cost pools — which GL accounts roll into each pool and how they cascade.
Browsing the pool grid
- Click the
Pool Configurationtab. - If no pools are configured, an empty state appears; contact Admin to set them up.
- Otherwise, a grid shows each pool as a card. Each card includes:
- Pool name (e.g., "Fringe — Non-SCA")
- Pool category in small text below
Order [N]badge — the cascade sequence (Fringe first, then Overhead, then G&A)- Current rate percentage (if calculated for the selected year)
Base Type— how the rate is calculated (e.g., "Direct Labor", "All Labor", "Total Cost Input")Pool Accounts— GL account codes that feed this pool (scrollable list; shows first 8, with a "+N more accounts" note if longer)Labor Filter— if set, a text label restricting which labor entries roll inView Monthly Detaillink in teal at the bottom right
Pools are always applied in cascade order. Fringe pools run first, then their base accumulates upward to Overhead, and so on. This cascading ensures no double-allocation of base amounts.
Drilling into a pool
- Click any pool card to open its monthly detail view.
- A
Back to Poolsbutton appears at the top left. - The main card displays:
- Pool name as a heading (e.g., "Fringe — Non-SCA")
- Subheading showing the pool category and the text "— [YEAR] Monthly Breakdown"
- The drill also says why the rate moved. An account table compares each pool and base account this year against last: Account, Description, YTD, Prior YTD, Change and Rate impact, so the accounts that moved the rate stand out. The Rate Targets guide's section Why a rate moved — the pool drill explains how to read it.
Reviewing monthly rates
- A table shows each month (Jan through Dec) with four columns:
Month— the month name (sticky left column for easy horizontal scrolling)Pool Amount— total costs accumulated in that pool for the monthBase Amount— total base (labor or cost input) for the monthRate— the calculated rate (pool amount ÷ base amount)
- Rows with no activity (both amounts = 0) appear slightly faded.
- At the bottom, a highlighted
YTD Totalrow sums all months and shows the year-to-date rate.
Rates will display as "—" if the base amount is zero (rate cannot be calculated). This is normal early in the fiscal year.
Reviewing pool and base accounts
- Below the monthly table, two additional card sections list:
Pool GL Accounts (N)— the specific GL accounts feeding this poolBase GL Accounts (N)— the accounts that form the allocation base
- Each account displays its code (monospaced) and description. These are pulled from your accounting system's chart of accounts.
Tab 3: Rate Trend
This tab plots how your indirect rates have changed over multiple fiscal years, helping you spot inflation or structural shifts.
Viewing trend data
- Click the
Rate Trendtab. - If only one year of data exists, a note says "Only 1 year(s) of data available. Trend analysis improves with additional years."
- A table displays one row per fiscal year with seven columns:
Year— the fiscal year (current year marked with a small "Current" label in teal)Fringe (Non-SCA)— fringe rate for that yearFringe (SCA)— SCA fringe rateOverhead— overhead / FAC rateG&A— G&A rateWrap (Non-SCA)— fully burdened multiplierWrap (SCA)— fully burdened multiplier
- The current year's row is highlighted with a subtle teal background.
- Values show as percentages or multipliers (e.g., "2.50x"); missing data shows as "—".
- Click any column header to sort the trend table, and use the
Exportbutton in the table header to download it as a branded Excel workbook for sharing with your finance team.
Use this tab to identify rate inflation patterns (e.g., "Fringe climbs every year" or "Overhead dropped last year due to headcount changes"). Share these trends with your finance team when forecasting next year's labor burden.
How to know it worked
- You can view all four tabs without errors.
- KPI cards or pool cards display rates (not empty or error states).
- Drilling into a pool shows monthly detail with non-zero amounts in at least one month.
- The year selector updates the data when you change it.
- The
Rate Trendtable shows rates for multiple years (if available).
Related
Dashboard — executive overview of cash and profit
Financial Statements — P&L, Balance Sheet, and Cash Flow powered by these pool rates
Forecast → Cockpit tab — adjust labor burden assumptions via dial controls
Accounting → Indirect Rates — view computed vs. provisional DCAA rates and 12-month trend (compliance focus)
Accounting → Forward Pricing — build FPRP submissions using these rate structures