Contract Portfolio
Your contracts are the business — every dollar of revenue, every margin, every recompete risk starts with a contract. Contract Portfolio is the one place to work all of them: see how the whole book is performing, keep contract data clean, drill into any single contract's cost report, and group contracts the way you actually think about them. It's the operational hub that feeds everything downstream — My Programs, the performance reports, and the forecast.
Who uses it: anyone who owns contract performance — leadership across the whole portfolio, division leads within their own division. Everyone with FP&A access can view; editing contract details is reserved for leadership and division-lead roles.
Which view do I want?
Three surfaces touch contracts, and it's easy to reach for the wrong one:
| I want to… | Go to |
|---|---|
| Work the whole book — manage contracts, monitor performance, fix data, drill into cost reports | Contract Portfolio (this page) |
| Glance at my division's health — revenue, margin, backlog at a glance | My Programs |
| Enter the forecast inputs and assumptions that drive projections | Forecast |
Contract Portfolio is where you do things; My Programs is a read-only division snapshot; Forecast is where forecast inputs are entered and governed.
Finding it
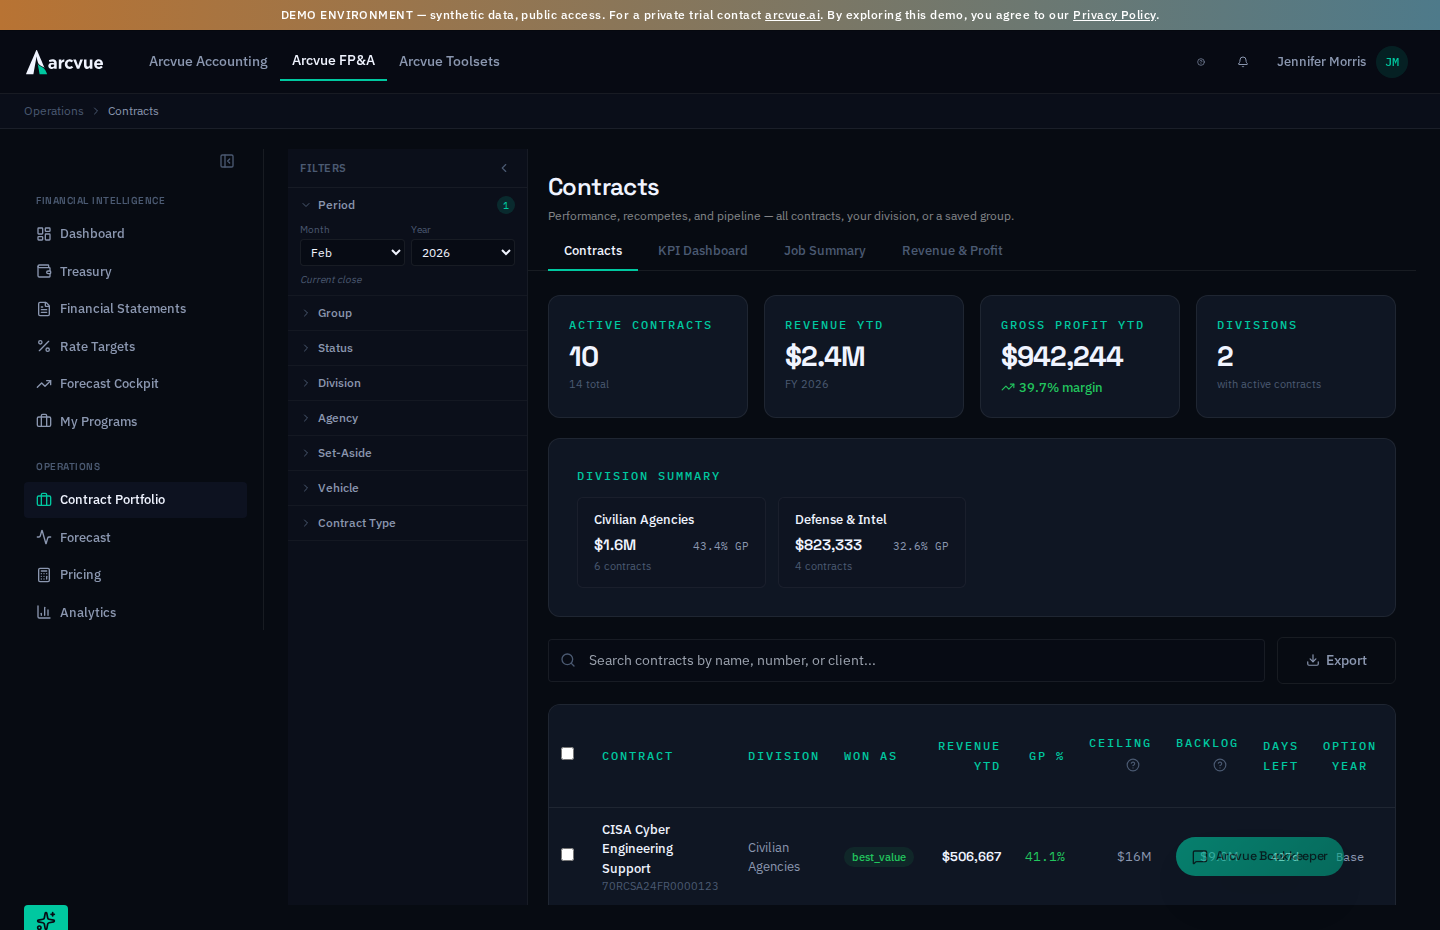
FP&A → Operations → Contract Portfolio (the briefcase icon). The page opens on the Contracts tab, with four tabs across the top — Contracts, KPI Dashboard, Job Summary, and Revenue & Profit — and a filter rail down the left that scopes every tab at once.
The filter rail
The left rail sets what every tab shows. It's a set of collapsible sections:
- Period — the fiscal year and as-of month everything is measured through.
- Group — one of your saved contract groups (see Saved groups, below); picking a group overrides the other filters and pins the view to just those contracts.
- Status — Active, All, or Expired.
- Divisions · Agencies · Set-Asides · Vehicles · Contract Types — multi-select facets, each showing a live count of how many contracts match. Selected filters appear as removable chips above the tabs, and Clear all resets everything.
Collapse the rail with the chevron when you want more room; it remembers your choice.
The chips across the top, and the two that do not clear
Every filter you have on shows as a chip above the list. There is one chip per dimension, not one per value, and each carries an X.
| Chip | What it is filtering on |
|---|---|
| Division | The divisions you picked (shown by name, not by number) |
| Agency | The customer agencies |
| Set-Aside | The socioeconomic categories |
| Vehicle | The contract vehicles |
| Contract Type | Firm-fixed-price, time and materials, cost-plus and so on |
| Status | Active, closed, or every status |
| Group | A saved group you are looking through |
| Manual selection | The contracts you ticked by hand |
One X clears the whole dimension. A chip reading Division: Ops, Health, Civil has a single X, and pressing it removes all three — not the last one you added. To drop just one value, go back to the rail.
And two of the eight do not clear to nothing — they reset to a default.
- Status goes back to active contracts, not to every status. So dismissing that chip does not widen the list to the whole book; it narrows it back to the default view.
- Group goes back to no group, which is the whole book.
The other six chips genuinely remove their filter. All eight look the same and all eight have the same X, which is why this is written down: after dismissing the Status chip you are still looking at a filtered list, and nothing on the screen says so.
The rail itself: collapse it, and clear it
The whole rail folds away. Collapse filter rail gives the contract table the width back; Expand filter rail brings it out again. Collapsing changes nothing about what is filtered — your filters stay exactly as they were, out of sight.
Clear all filters resets the rail. Read the chips section above before you reach for it: two of them reset to a default rather than to nothing, so a cleared rail is not the same as no filter at all.
The period is in the rail and is NOT a filter
Month and Year sit in the rail beside the filters, and they do something categorically different from everything around them.
Every other control in this rail decides which contracts you see. The period decides what every trailing number means. It is the as-of anchor. The trailing windows — month to date, three, six and twelve months — are all computed backward from the month you set here, on the server. Move it and the same contracts stay on screen carrying different figures.
So a surprising margin or runway figure has two possible causes, and they look identical on the page: the contract genuinely moved, or the anchor is not where you thought it was. Check the period before you investigate the contract.
Clearing the filters does not reset the period. It is not a filter, so
Clear all filters leaves it exactly where you put it.
Current close tells you the anchor is where it should be
When the month you have chosen is the tenant's own current close, the rail says Current close underneath. It is a label, not a button.
Its absence is the useful signal. No label means you have scrubbed away from the close and every trailing figure on the page is anchored to some other month — which is fine when you meant it and is the explanation when you did not.
You can anchor on a month that has not happened
The Year list runs from one year ahead back through five years behind, so a future month can be selected. That is deliberate — accrual work reaches forward — but it means the trailing windows will happily anchor on a month nobody has closed, or lived through. If the trailing numbers look thin, check whether the anchor is in the future.
Contracts — triage the book
The landing tab is built for a fast read on the whole portfolio.
- Four KPI cards: Active Contracts, Revenue YTD, Gross Profit YTD (with the margin percent), and the number of Divisions in scope.
- Division breakdown: a card per division with its revenue, margin, and contract count. Click one to filter the whole page to that division.
- The contract table: one row per contract — name/number/client, division, Revenue YTD, GP% (color-coded), ceiling, remaining backlog, days left on the period of performance (amber inside a year, red once expired), the current Option Year (e.g. OY2 of 3, or Base during the base period), Days Left in OY (days remaining in the current option period, amber inside 90 days, red once elapsed), and status. A performance icon on each row launches that contract's deep-dive. Search by name, number, or client; Export downloads the portfolio to Excel.
- "Contracts need details": when any contract is missing key data, a button surfaces the count and opens the triage drawer (below).
Working a single contract
The AI analysis is not produced until you ask for it. Generate runs it and reads Analyzing... while it works; until then the panel says so rather than showing a stale result.
Click any contract row to open its drawer, which has two tabs:
- Contract Info — the contract's metadata: type, vehicle, NAICS, capability, set-aside, agency, period of performance, ceiling, and funded value. Click Edit to change these (leadership/division-lead roles), then Save. Below the fields, the forecast parameters — recompete, PWIN%, annual growth — are shown read-only, with a link to edit them in the Forecast module (they live there deliberately; see Forecast parameters, below).
- Performance — the contract's Revenue YTD, GP margin, backlog, and funded-remaining, plus a monthly trend of the last year's actuals. For the full cost-report deep-dive, use the performance icon to open Program Performance (PMR) on that contract.
Keeping contract data clean
The missing-details drawer (the "need details" button) is where you close data gaps that would otherwise distort every report:
- Scope toggle: Active, +Historical, or All.
- For each contract with gaps, it lists the missing fields with inline inputs — fill and save right there. It also flags SCA verification (confirm whether the contract carries Service Contract Act labor) and lets you confirm active status on contracts that have gone quiet, so a dormant-but-real contract isn't mistaken for a closed one.
Saved groups
When you repeatedly analyze the same set of contracts — a customer, a capability area, a portfolio you own — save them as a group. Select contracts with the row checkboxes, then Save as Group (new, or append to an existing one). Recall a group any time from the rail's Group dropdown, and manage them (rename, change members, delete) from Manage Groups, where each group also carries a Description (optional) — worth filling in, because a group named for a customer tells the next person nothing about why those particular contracts are in it.
The group list pages. Once you have more groups than fit, ← Previous and Next → sit either side of a page / total counter, and each one grays out at its end of the range. Nothing on the first page says a second exists apart from that counter — so read it before concluding a group was never saved.
The saved-groups table shows each group's description, how many contracts it holds, and Last updated — which is what tells you whether a group is still being maintained or was built once and left behind.
When the contract list cannot load. Changing a group's members lists the tenant's contracts to tick on and off. If that request fails, the list says so and offers Retry rather than reporting that this tenant has no contracts. The distinction matters more here than anywhere else on the page: saving a group against a list that failed to load would leave out members that exist, and the saved group would look complete afterwards.
Making a group out of what you have selected
Tick contracts in the list and a bar appears above it saying how many are selected. That selection is itself a filter — it is the Manual selection chip — so the two work together rather than being separate ideas.
The bar offers three things: open Program Performance for exactly those contracts, save them as a group, and an X that drops the selection.
Save as a group opens a small dialog with two modes:
- New group — give it a Name, and optionally a Description (optional) saying what the group is for. The name is required, and a name already in use is refused rather than quietly creating a second group with the same name.
- Add to existing — pick the Group to append to, and the selected contracts join it. Cancel closes without saving either way.
Saving a group is switched off in a demo workspace, and the button says so when you hover rather than simply looking dead.
The analytical tabs
Beyond the Contracts tab, four tabs turn the same filtered scope into different lenses:
-
KPI Dashboard — four executive panels: upcoming recompetes plotted by how soon they're up against how much revenue they carry (so the big ones don't sneak up), contract performance ranked worst-margin-first, margin change for contracts that moved materially over the last quarter, and funding/backlog flags for contracts burning toward the edge of their funded runway.
-
Job Summary — the full cost report aggregated across every contract in scope: revenue, labor, other direct costs, the indirect pools, and the margin subtotals, laid out by month. This is the P&L structure of your delivery.
-
Revenue & Profit — the same data pivoted to one row per contract by month, with a toggle for revenue, cost, gross profit, or GP%. On the gross profit and GP% views, a dash means the contract has revenue and no recorded cost for that month, or in the total column for the whole range. With nothing to subtract, revenue alone would read as 100% margin, so the grid shows no figure instead. A genuine zero shows as 0.
-
Program Modeler — one contract's funding runway, and what happens to it if you change the staffing. Covered below.
Across these, months that haven't closed yet show a dash rather than a partial figure.
The four risk badges
These are two independent dimensions, not one severity ladder, and a contract can carry one from each.
| Dimension | Warning | Serious |
|---|---|---|
| Funded runway — how long the money lasts | Funding Low | Funding Critical |
| Burn against total backlog | At Risk | Over-Burning |
A contract showing Funding Low and Over-Burning together is not
contradictory — it is a contract whose funded increment is thin and which is
consuming its whole backlog faster than planned. Reading the badges as a
ladder makes that pair look like a bug and hides the worst case on the board.
Two charts on this tab carry their meaning in their axes:
- Days Until Recompete against Avg Monthly Revenue L12M — the scatter that shows what is at stake and how soon. The top-left quadrant is the one to look at: large revenue, little time.
- GM% L3M — gross margin over the last three months, sorted ascending, so the contracts you least want to see are first.
Both windows are stated in the label for a reason. L12M and L3M answer different questions — what a contract is worth, and what it is doing lately — and a contract can be healthy on one and deteriorating on the other.
The margin table — which contracts are getting worse
The KPI tab's first table ranks contracts by how their gross margin has moved. Recent 3M GM% is the trailing three months; Prior 3M GM% is the three before that; Monthly Rev is the average monthly revenue over the window. Reading the two margin columns as a pair is the point — a low margin that is stable is a pricing fact, and a healthy margin that dropped between the two periods is a change, and only the second one is news.
The runway table — which contracts run out of money before they run out of time
Under the KPI panels is a per-contract runway table. Every column after the first two is arithmetic on three inputs, and knowing which three makes the whole table readable:
| Column | What it is |
|---|---|
| End | The end of the period of performance. |
| Funded Backlog | Funding on the contract, less revenue recognized to date. Red when negative — you have recognized more than is funded. |
| Total Backlog | The same against the ceiling rather than the funding. Ceiling is the most the contract could ever be worth; funding is what has actually been put on it. |
| Burn Rate | What the contract consumes per month. |
| Fund mo | Funded Backlog ÷ Burn Rate — months of funded runway. Amber under six, red at zero or below. |
| Total mo | Total Backlog ÷ Burn Rate — months of runway if the whole ceiling were funded. |
| End mo | Months from today until the period of performance ends. |
| Variance | Total mo minus End mo, signed. |
Read Fund mo against End mo and you have the question the table exists to
answer: funded months smaller than remaining months means the money runs out
before the work does, and a modification has to be in flight. That is the same
gap the Program Modeler's mod-by date puts a date on, below.
Variance answers the ceiling version of that question and it is worth
reading in both directions. Negative — amber — means even the full ceiling
does not cover the remaining term, so this contract cannot be fixed by funding
alone. A large positive number, over eighteen months, is flagged too: far more
ceiling than time to consume it, which usually means the burn has fallen off
rather than that the contract is healthy.
A contract missing from this table is not a healthy contract. Any contract with no recent burn is left out entirely — not listed, not flagged. That is deliberate and it is right: with no burn there is no runway to compute, and a new or paused contract should not be labeled critical merely because the arithmetic is unavailable. But it means the table shows you the contracts it can measure, not all of your contracts. If you are looking for one and cannot find it, check whether it has burned anything recently before concluding anything from its absence.
The Job Summary table reads one Cost Report Item per row with months across the top; the item column stays put as you scroll sideways.
Overview — the contract list
The Overview tab lists Contract, Division, Won As, Revenue YTD and GP %. Won As records how the work was won and is the field the new-business and growth reporting reads, so it is worth keeping accurate even on contracts that are long since running.
Above the list, Search contracts by name or number filters it, and Select all on page selects the visible rows — the page, not the whole filtered set, which matters when you have filtered to more than one page. Actions on a row opens what you can do to it, and saved groups carry Edit group and Delete group.
Overview also carries a Division Summary card set above the list, and, on a single contract, a Monthly Performance chart.
Edit Contract is the inline editor on a contract's own panel — the same button saves, so it toggles between editing and saved rather than opening a separate form. Prime/Sub is one of its fields, recording whether you hold the contract directly or sit under another prime. Contract Number is one of its fields only for an administrator; everyone else reads it there, because the number is the key the accounting register's ownership crosses on, and a program renamed to another program's number would own that program's estimate and reserve. A program opened before its award was known carries a placeholder here; once the Accounting register holds the award number, the nightly sync fills it in, unless that number already identifies another program, in which case it reports the collision and leaves both alone.
Division is on the same editor: the division whose board the program appears on, chosen from your own divisions. Leaving the pick blank never clears a division already set.
Programs that arrive from Arcvue Accounting
When a contract is uploaded and accepted in Arcvue Accounting, its program line opens here on its own — you do not create it twice. It carries everything the award document states, and it takes the name your team gave the contract on the Contracts register, following it if the register's name changes. The program is filed under the customer, agency, vehicle, capability and division your other programs with the same customer already use. Where your register has no precedent, Arcvue picks from your own lists and notes that it did so, so the pick is yours to confirm rather than a silent guess.
What the award does not state, the program still needs from you, and the Contracts Needing Details drawer lists it — the same drawer the accounting team works from the Contracts register, scoped Active, + Historical or All (incl. Canceled). A contract retired in favor of a live successor is not asked for an end date there. The Contract Register guide (Accounting) walks the drawer field by field.
Program Modeler — when does the funding run out, and what moves that date
The other three tabs report. This one models. It answers three questions in the order a program manager actually asks them:
- When does this contract burn through its funding? — the runway chart.
- By when must I request the modification? — the hero tile.
- What would staffing changes do to that date? — the levers.
The baseline is the plan of record, and the levers never touch it
The baseline is closed months from actuals and forward months from the approved forecast. Every lever you pull builds a scenario alongside it — nothing you do here edits the plan, the forecast, or the contract.
A saved scenario is a what-if, not a funding mod. Saving one records your assumptions so you can come back to them or show somebody. It does not add funding to the contract, and nothing downstream treats it as though it had. A real modification is a contract document and reaches Arcvue through document ingest. If you model a mod here and stop, the contract's funded value has not moved.
The levers
| Lever | What it models |
|---|---|
| Funding event | A modification you expect — a label and an amount, effective from a month. Raises the funding line in the scenario only. |
| Add a position | A seat you intend to fill: bill rate, pay rate, how many, and the months it charges. Bill rate drives revenue and funding burn; pay rate drives cost and margin and never touches the funding line. |
| Occupancy window | A seat that is vacant or partly covered for a stretch — Fully vacant, 25% covered, Half covered, 75% covered. This is the honest way to model a gap you already know about. |
| Forward burn ±% | A catch-all knob: scales revenue burn on every forward month by that percentage. It is there for the variables the other three do not name, so reach for it last — a number you cannot attribute to a position, a funding event or a vacancy is a number nobody can defend later. |
Months already closed as actuals cannot be re-staffed and are skipped: you cannot model your way backwards through a month the books have shut.
Mod lead time is in that row too, and it is not a lever
It sits beside Forward burn ±% and behaves differently from everything above it. Mod lead time (days) — 60 unless you change it — is how long your customer takes to get a modification signed. Arcvue subtracts it from the date funding runs out to tell you the date you have to start, which is the number you act on: the runway date is when the money ends, and the mod-by date is when it is already too late to do anything about it.
It applies to the baseline and the scenario alike, because it is a property of your contracting shop rather than a what-if. So changing it moves the baseline's own mod-by date — the only control here that does. That does not contradict the rule above: it still edits no plan, no forecast and no contract. It changes a date Arcvue derives for you, on both readouts, which is a different thing from building a scenario.
Set it to what your customer actually takes. A 60-day default against a shop that needs 120 tells you to start on a date that has already passed.
The panel is headed What-if levers, and when any are active it offers a way to clear them.
Filling in a lever
Each lever opens a small form, and the fields are the lever's assumptions made explicit:
- Add a position asks for the name of the position being added in this scenario, how many seats of this position to add, and its Bill rate /hr and Pay rate /hr. Bill rate drives revenue and funding burn; pay rate drives cost and margin and never touches the funding line, which is why both are asked for separately rather than derived from a markup.
- Funding event asks for a funding event label, e.g. the expected modification number, and the funding amount added by this event, in dollars. Give it the modification number you expect rather than a description — when the real mod arrives, the label is how you recognize the assumption you made.
- Occupancy window asks for the staffed seat this vacancy window applies to and the Coverage — how much of that seat is covered while the window lasts.
Removing an assumption is per-row, not per-scenario. Each added position, funding event and vacancy window carries its own control — remove this added position from the scenario, remove this funding event from the scenario, remove this vacancy window from the scenario — so you can take one assumption back out without rebuilding the rest.
Saving and reloading a scenario
Name for the scenario being saved is the only thing saving asks for, and cancel saving this scenario backs out without writing. Load a saved what-if scenario for this contract brings one back.
Name a scenario for the question, not the date — "if the two analysts start in March" is findable a month later; "scenario 3" is not. Saving records your assumptions so you can return to them or show somebody; it still does not add funding to the contract, as the warning above says.
The monthly detail
Under the chart, one row per month:
| Column | What it is |
|---|---|
| Month | The period. |
| Source | Where the figure comes from — closed actuals, the approved forecast, or a flat estimate when neither exists. Read this before trusting a month. |
| Burn | Revenue billed that month per the plan of record — the measure that draws funding down. |
| Scenario burn | The same month with your levers applied. It appears only while a lever is active, and is tinted where a lever moved it off the plan. |
| Cumulative | Running total of burn from the start of the period of performance through that month. |
| Funding | Funding available through that month — the funded value plus any scenario funding events effective by then. |
| Remaining | What is left. Where this crosses zero is the runway date. |
When it refuses, and why that is right
- No period-of-performance dates — the tab says which field to fix rather than guessing a window.
- No funded value — it still models the burn but draws no funding line at all. That is deliberate: a zero funding line would render as a staircase hitting exhaustion immediately, which is a confident wrong answer rather than a missing one.
Program Performance (PMR)
From any contract row (or by multi-selecting several and choosing View Performance), you open Program Performance — the full-screen cost-report deep-dive with trailing-window KPIs, a multi-year trend, and, for a group, a per-contract breakdown. See the My Programs & Program Performance (PMR) guide for how to read it.
Forecast parameters
The forecast inputs attached to a contract — whether it recompetes, its probability of win, its annual growth — are shown here read-only, but you edit them in the Forecast module, not on this page. That's deliberate: forecast inputs are governed separately (they drive firm-wide projections and are role-gated), so they can't be changed accidentally while you're doing routine contract maintenance. Use the Edit in Forecast link to jump there.
Where the numbers come from
- Revenue, cost, and margin are your contract actuals — real booked figures, bounded at your last closed month (unclosed months show a dash).
- A margin is never computed from revenue alone. A contract with revenue and no recorded cost shows a dash for its margin rather than 100%, on its row and in its detail, and so does its division's card, because blending it in would count all of its revenue against other contracts' cost; the Gross Profit YTD card leaves its margin off for the same reason. A division whose every contract carries cost keeps its margin. Job Summary works the same way by month: a month with revenue and no direct cost shows a dash in every margin row, and so does the year's total.
- Ceiling and funded value come from the contract record.
- Backlog is the ceiling less inception-to-date revenue; it reads zero once a contract ends or goes inactive.
- Funded Backlog is the narrower one, and it's the number a PM acts on: the funded value less inception-to-date revenue. Divided by the burn rate it gives the months of funded runway the funding flags key on — a contract can have years of ceiling left and be weeks from running out of money.
- The recompete, margin, and funding signals are computed from the same actuals plus each contract's period-of-performance and funding.
Roles
Everyone with FP&A access can view the portfolio, scoped by role — leadership sees every division; division leads see their own. Editing contract details, marking a contract inactive, and confirming active status are reserved for leadership and division-lead roles; everyone else sees the data read-only.
Troubleshooting
- A contract's backlog or days-left looks wrong. Check its ceiling, funded value, and period-of-performance in the detail drawer — the missing-details drawer surfaces exactly which fields are unset.
- Future months are blank in Job Summary / Revenue & Profit. Intentional — figures stop at your last closed month rather than showing a partial period.
- A contract shows revenue but a dash for gross profit or GP%. No cost is recorded against it for that month, so the grid will not compute a margin from revenue alone. The figure appears once cost reaches the contract.
- A contract I expect is missing. Check the Status filter (it defaults to Active) and any division/agency facets in the rail; a saved group in the Group dropdown overrides all other filters.
- I can't edit a contract's forecast parameters here. By design — use the Edit in Forecast link; forecast inputs are governed in the Forecast module.
- A dormant contract is flagged as needing review. Confirm its active status in the missing-details drawer so it's not mistaken for closed.
Related pages
- My Programs & Program Performance (PMR) — the read-only division dashboard and the per-contract performance deep-dive launched from here.
- Forecast — where the contract-level forecast inputs (recompete, PWIN, growth) are entered and governed.
- Financial Statements — the company-wide P&L these contract numbers roll up into.
- Accounting → Contract Register — the accounting/GL-side view of contracts, distinct from this FP&A operations view.