Rate Targets — Indirect Rate Planning
Indirect rates decide whether your bids win and whether your contracts make money. Fringe, overhead, and G&A are the burdens layered on top of direct labor to recover the cost of running the company — and if your rates drift, every proposal and every project margin drifts with them. Rate Targets is the forward-looking view of those rates: what they are today, how each pool is built, and where they're trending over the next several years.
It's the planning companion to the accounting side. In Arcvue Accounting, indirect rates are computed from posted actuals and submitted to DCAA; here in FP&A, Rate Targets shows the same rate structure as a forecast — targets you're steering toward and the multi-year trajectory — so you can see a rate problem forming before it shows up in a bid.
Who uses it: finance and pricing leads who own the indirect rate structure. Everyone with FP&A access can view it; editing the pool structure and recomputing rates is reserved for leadership/admin roles.
Finding it
FP&A → Financial Intelligence → Rate Targets (the percent icon in the left nav). Don't confuse it with Accounting → Indirect Rates — that's the actuals-and-submission view; Rate Targets is the FP&A planning view. Three tabs run across the top: Current Rates, Pool Configuration, and Rate Trend.
The ideas you need first
A quick mental model makes every screen here readable.
A rate is a pool divided by a base. An indirect pool is a bucket of cost (all your fringe benefits, say); its base is the direct activity you spread that cost across (direct labor dollars). The rate is simply pool ÷ base — "fringe is 30%" means fringe cost equals 30% of direct labor.
The pools cascade. GovCon indirect rates stack in a set order, each one's base building on the ones before it:
- Fringe — benefits, payroll taxes, paid time off — applied to direct labor. Arcvue tracks two fringe rates where relevant: a standard one and a separate SCA rate for Service Contract Act (wage-determined) labor.
- Overhead / FAC — the cost of executing the work (facilities, tools, project management) — applied to value-added (direct labor + fringe + a couple of allocated pools).
- G&A — the cost of running the company (executives, finance, HR, BD) — applied to total cost input (value-added + overhead), so it touches nearly everything.
- Material Handling and Facilities round out the structure; Facilities is typically allocated into overhead and G&A rather than carrying its own published rate.
Wrap is the whole burden in one number. The wrap rate multiplies the cascade together: wrap = (1 + fringe) × (1 + overhead) × (1 + G&A). It's shown as a multiplier, not a percent. Illustration: with fringe 30%, overhead 25%, and G&A 12%, the wrap is 1.30 × 1.25 × 1.12 ≈ 1.82 — every $1 of direct labor costs about $1.82 fully loaded. That number is what your pricing uses to mark labor up to a billing rate.
Current Rates
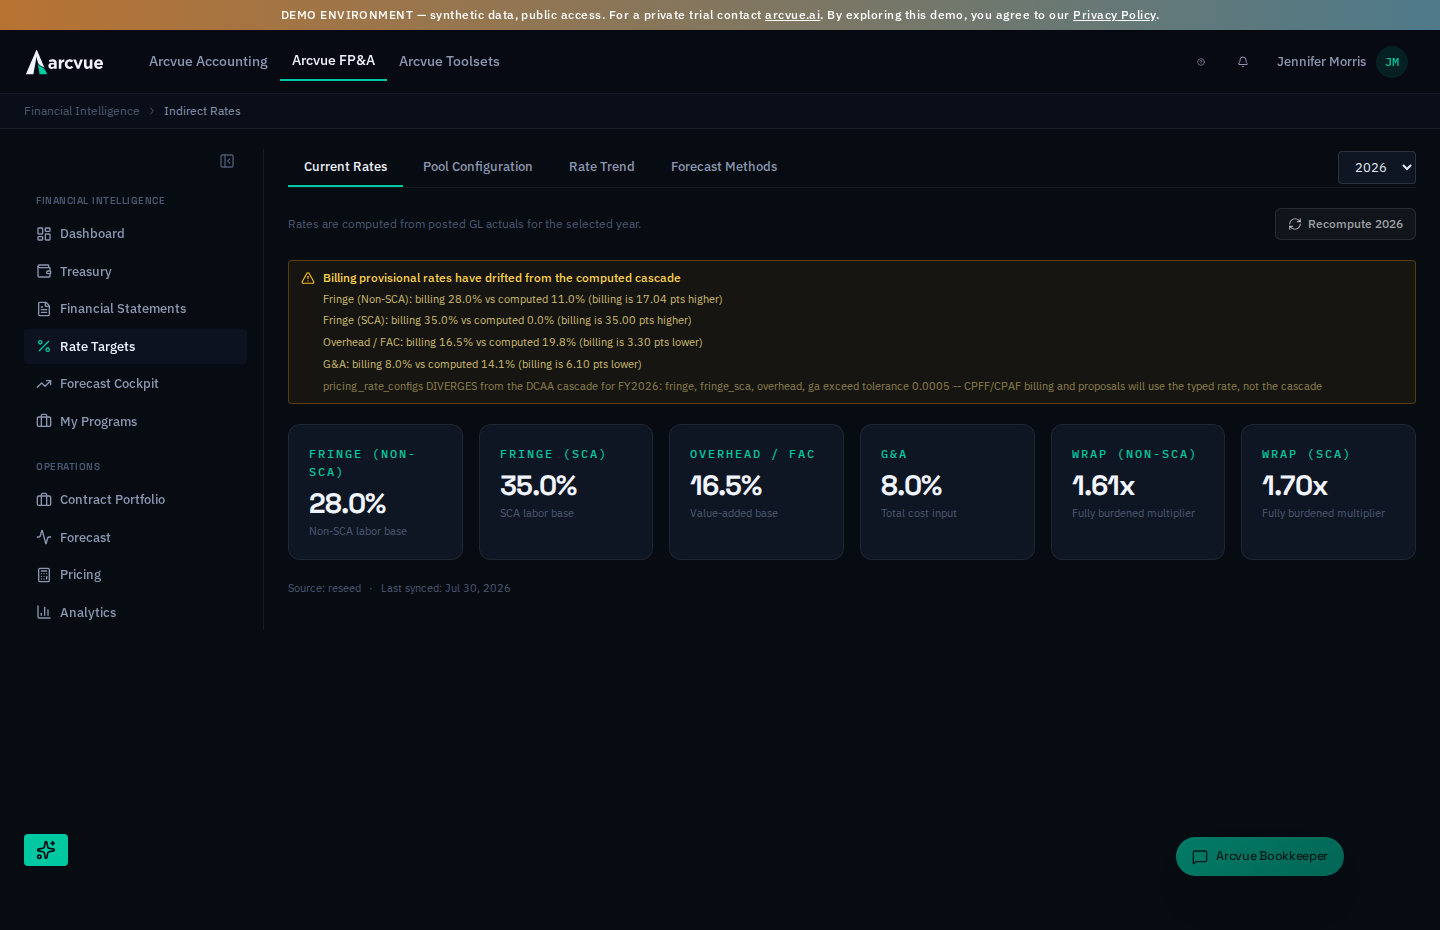
The landing tab shows this year's rates at a glance. Pick a fiscal year (top-right, when more than one is available) and you get KPI cards for Fringe (Non-SCA), Fringe (SCA), Overhead / FAC, and G&A as percentages, plus Wrap (Non-SCA) and Wrap (SCA) as multipliers. If your rates are configured at the pool level, a Pool-Level Rates table lists each pool with its rate, the base it applies to, and its source. A small line at the bottom tells you where the rates came from and when they were last synced.
If nothing shows, the card reads "Indirect rates not configured" with a shortcut to set them up in Admin.
When the billing rates and the computed rates disagree
Two amber warnings can appear on the Current Rates tab. Each appears only when it has something to report.
Billing provisional rates have drifted from the computed cascade. Your billing rate set (the provisional rates that CPFF/CPAF invoices, proposals and forward pricing use) no longer matches the rates this page computes. Each pool that has drifted gets a line showing both rates and how many points billing is higher or lower. Reconcile before the next CPFF/CPAF invoice run, because every invoice built in the meantime bills at the drifted rate. Two rates that are not on the same basis are not compared, so their difference is never reported as drift.
Billing and incurred-cost rates do not rest on the same source. The billing rate set and the incurred-cost rates on file (what the incurred cost submission and the close checks read) are compared year by year, and each gap gets its own line: a year with rates on file but no billing rate set, with a note when its figures equal another year's exactly, because that is a carried-forward copy rather than that year's rate; a year with a billing rate set but no incurred-cost rate on file; an incurred-cost copy last synced before the billing rate changed; or a pool whose two rates differ. For the current year or a later one, the line tells you to enter that year's provisional rate set before billing or filing on it.
Pool Configuration
This tab is the catalog of your indirect pools. Each pool is a card showing its category, its place in the cascade (the order badge), the base it's allocated over, and the ledger accounts that feed it. It's read-only here — the structure is edited by an admin (see below).
Click any pool to drill into its monthly detail: a month-by-month table of the pool's cost, its base, and the resulting rate, with a year-to-date total at the bottom. Below that, the exact ledger accounts in the pool and in its base are listed, so you can see precisely what's driving the number. Months that haven't closed yet show a dash rather than a half-formed rate.
Rate Trend
The trend tab is the multi-year picture: one row per fiscal year, with fringe, overhead, G&A, and both wrap rates across the columns, the current year flagged. Closed years reflect actuals; future years are projected from your forecast, extending several years out. This is where you spot the trajectory — a rate creeping up as a pool grows faster than its base, or a wrap climbing toward the point where your pricing stops being competitive. (Trend analysis needs at least a couple of years of data to be meaningful.)
Why a rate moved — the pool drill
The trend says how far a rate ran. Drilling into a pool says why.
Open a pool and the drivers panel breaks the change down account by account:
Account, Description, YTD, Prior YTD, Change, and Rate
impact — the last in points (+0.42 pts), red where an account pushed the
rate up and teal where it pulled the rate down. A bar chart above the grid ranks
the same accounts, and the grid exports.
Underneath, Base effect carries the half that is not in the pool at all: the base's own contribution, because a growing base dilutes a rate and a shrinking one concentrates it. It names the base moving from one figure to the other, and it is the line that tells you where to go — fix a base problem in the base accounts, not in the pool.
The arithmetic is exact, and the panel says so: the account drivers plus the base effect sum to the rate change. Nothing is parked in a residual, so a figure that surprises you belongs either to a named account or to the base, and you can go straight to it.
A line beneath does the same for the latest closed month against the one before, naming the accounts that moved it.
The monthly table behind a pool shows Pool Amount against Base Amount for each month, with the resulting rate beside them. A rate is a quotient, so a month can move because the pool moved, because the base moved, or both — these two columns are how you tell which, and the rate alone cannot.
Months with no data are dimmed rather than shown as zero, which matters: an empty month and a genuinely zero month are different facts, and a zero would average into a trend that a blank does not.
The contribution chart names the accounts that moved the rate most, and closes with All other accounts.
All other accounts is an aggregate, not an account. It is
everything below the top few, summed — so a large bar there means the movement
is spread across many accounts rather than concentrated in one, which is a
different problem with a different fix. A "Base effect" bar appears beside it
when the base itself moved the rate.
Where the numbers come from
Every rate here traces to your ledger and forecast — nothing is hand-entered as a headline number:
- Each rate is computed as pool cost ÷ base, summed from the ledger accounts assigned to that pool and base in the configuration.
- Actuals through your last closed month; forecast beyond. For a closed year, all twelve months come from posted actuals. For the current year, closed months use actuals and the remaining months use your forecast. Future years are entirely forecast. Unclosed months never show a guessed rate — they stay blank.
- The multi-year trend is driven by your forecast (contract forecasts, indirect-cost forecasts, and new-business assumptions), so the out-years move as your pipeline and cost plans change — not a flat extrapolation.
- Where the closed-month actuals come from depends on your ERP source — but the rate structure is always single. Three cases: (1) FP&A only — the actuals behind each rate come from your connected external ERP, and rates are computed here from your pool configuration and forecast (or seeded from onboarding); (2) Arcvue Accounting as your ERP source — closed-month actuals flow from the Arcvue Accounting general ledger, and Current Rates align with the provisional rates the accounting engine computes and submits to DCAA; (3) both products active — Rate Targets reads those same accounting-engine provisional rates directly, and the source line says so. In every case FP&A never computes rates a different way than Accounting when both are present — one rate structure, one answer key.
Forecast Methods
The fourth sub-view lists, per pool tier, how each account is forecast:
| Column | What it holds |
|---|---|
| GL Account | The account. |
| Method | How that account is projected. |
| Elasticity | The factor the chosen method applies, where it uses one. |
| Notes | Why it is set this way. |
| Updated By | Who last changed it. |
Updated By and Notes together are what make a method defensible.
A forecast method is a judgment about how a cost behaves, and the two columns
that record whose judgment it was and why are the ones an auditor or a successor
reads first — the method name alone tells them nothing about intent.
Accounts are grouped by tier, and a named tier is shown under its own name rather than being prefixed — so a tier called Fringe reads as Fringe, not Tier Fringe.
Configuring pools (admin)
The pool structure — which ledger accounts belong to each pool, what base each pool uses, and the cascade order — is edited in Admin by a leadership/admin role, not on this page. Everyone else sees the results, read-only.
Rates rebuild on their own as the year progresses: each closed month folds its actuals in, and the forecast drives the remaining months and the out-years, so a configuration change flows through on the next recompute cycle.
You can also force one. On the Current rates view, the Recompute [year] button in the top right rebuilds that year's rates immediately from the current configuration and forecast. It is a background job, so the button reporting "Recompute started — rates refresh when the job completes" means the work was queued, not finished; the page tracks the job and refreshes the rates itself when it lands. There is nothing to wait on and nothing to click twice.
The action is restricted to leadership roles — CEO, COO, admin, operations lead, finance lead. The button is visible to everyone, so if your role is not on that list you will see it, click it, and get a permission error rather than a queued job. That is the restriction working, not a broken page.
Troubleshooting
- "Indirect rates not configured." Your tenant hasn't had rates set up yet — an admin configures the pools (or the onboarding seed) in Admin.
- A fringe or wrap card shows a dash. That component isn't present for the selected year — commonly the SCA fringe rate when you have no Service Contract Act labor. Non-SCA rates fill in normally.
- Future months are blank in a pool's monthly detail. Intentional — rates stop at your last closed month; unclosed months aren't rated.
- The trend tab says it needs more data. Multi-year trend needs indirect rates for more than one fiscal year; it fills in as more years close.
- These rates differ from what Accounting submitted. Expect that in the out-years — Rate Targets is forward-looking (targets and forecast), while the accounting side is posted actuals and the submitted provisional rate. For the current closed period with both products active, they should agree; if they don't, check the fiscal year and that the accounting close is current.
Related pages
- Pricing — proposals apply the wrap rate to mark direct labor up to a billing rate; Rate Targets is where that wrap comes from.
- Accounting → Indirect Rates — the actuals-and-submission companion to this planning view (rate computation from posted transactions, DCAA provisional/final rates, ICS).
- Financial Statements — where the indirect pools land in the P&L that these rates are derived from.
Working with the tables
The indirect pool-rate breakdown is a sortable grid with a frozen header and one-click Excel export; the year-to-date position is surfaced as a summary card above it.
When a panel cannot load
An empty panel and a failed panel mean opposite things.
Pool configuration and Forecast configuration each report a failed
request with Retry, separately from the empty case. No pool configuration means the request completed and no pools have been set up for
your tenant -- a fact to act on. A failed request says only that the question
could not be asked, so nothing on the screen describes your setup until it
loads.
The two rate warnings on Current Rates work the other way round, because for a warning, silence is itself a claim. If the check behind them cannot run, the page says so in red, The rate-sync check could not run — this is not an all-clear., with Retry. Until it loads, a drift between your rates would not be shown, so the absence of an amber warning means nothing.