Analytics: Executive Reports and Exports
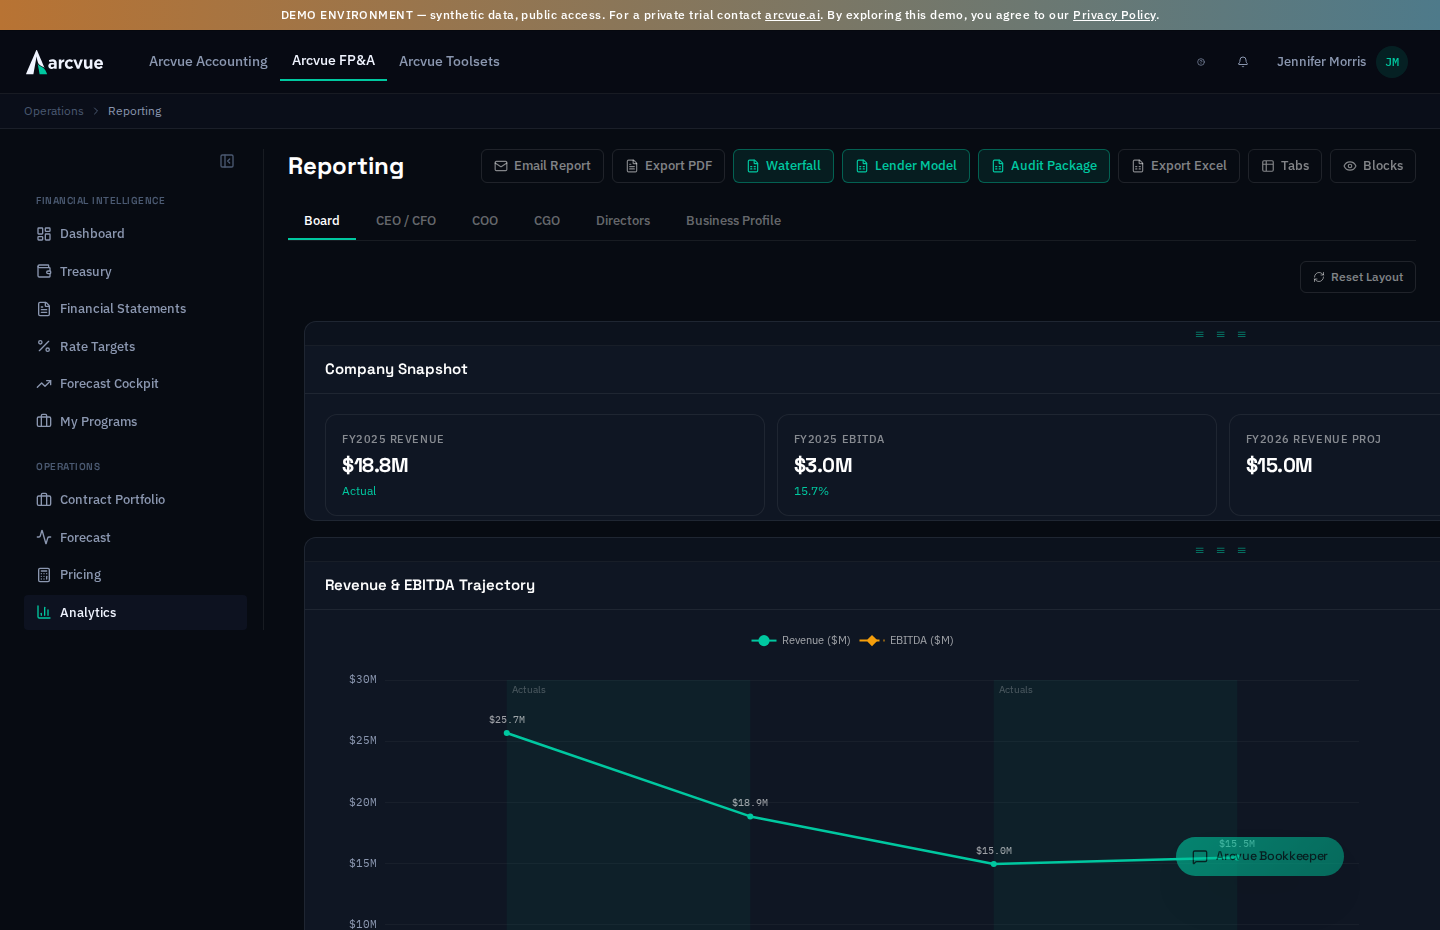
The Analytics surface is your executive reporting deck. It presents a set of pre-built, role-oriented report views — a Board pack, a CEO / CFO view, operating and growth views, a per-division Directors view, and a company profile — each assembled from live financial, pipeline, and contract data. Every view can be rearranged, trimmed to the blocks you care about, emailed, and exported to PDF or Excel. The surface also hosts three specialized workbook generators: a contract waterfall, a lender model, and an audit PBC package.
This guide covers the report tabs, how to run and filter them, and every export path.
Where it lives
- In the left navigation, open FP&A → Operations → Analytics.
- The page opens on a report view titled
Reportingat the route/reporting. - The first tab,
Board, loads by default. Your selected tab is remembered in the page URL, so a bookmarked or shared link reopens on the same report.
The report tabs
Across the top of the page, a row of tabs selects which report you are viewing. The active tab is underlined in teal.
Board— the board-level pack, including the revenue and EBITDA trajectory and division revenue breakdown.CEO / CFO— the executive financial view, including the trailing-twelve covenant chart.COO— the operating view, including monthly revenue and gross-profit trend.CGO— the growth view, including revenue composition and pipeline breakdown charts.Directors— the per-division view. This is the only tab that exposes aDivisionfilter (see below).Business Profile— the company profile view, including detailed breakdown tables.
Click any tab to switch reports. Switching away from Directors clears any division selection so the other reports always show the whole company.
Each report is composed of blocks — KPI groups, charts, tables, and narrative alert lists. The exact blocks depend on the report and on the underlying data. If a block has no data yet, it renders a short "No data available" style message rather than an empty frame.
Running and reading a report
Create records a new evaluation against the close date you set, and reads Saving... while it writes. An error appears above the button rather than replacing the form, so your entries survive a refusal.
- Select a tab. The report loads its blocks; while data is fetching you will see placeholder skeleton cards.
- Read the blocks top to bottom. KPI cards show a headline value and, where available, a delta. A card outlined in amber is flagging an alert condition.
- In narrative (alert) blocks, an item that references a contract is clickable and will take you to that contract.
- If the report fails to load, the view shows
Failed to load report datawith aRetrybutton — clickRetryto refetch.
The year selector, and what the charts plot
The year control offers This year and Next year — the base fiscal year and the one after it.
The projection blocks plot named series, and the names tell you the units:
- Revenue ($M) and EBITDA ($M) — in millions, on the trend chart.
- Existing Contracts and New Business — the revenue split, stacked.
- DSCR and Leverage — the covenant chart, each against its own axis, with your threshold drawn as a marked line so compliance is read off the picture rather than computed.
A New Business series reading zero is usually not a broken feed.
It means no growth target is set for that fiscal year — and the report says
so in its own notes rather than leaving you to guess. Where a target exists but
no monthly detail does, the annual figure is spread evenly across the year, and
the notes say that too.
Read the notes before re-running the report. They are where the report explains its own zeros.
Rearranging the layout
Each block sits in a draggable, resizable grid cell.
- Grab the drag handle at the top of any block (the row of grip marks) and move the block to reposition it.
- Drag a block's edge or corner to resize it.
- Your arrangement is saved automatically per report and restored on your next visit.
- To return to the standard arrangement, click
Reset Layoutat the top-right of the report body.
Layout is remembered per report tab and per your account. Rearranging the Board view does not affect COO or any other tab.
Showing and hiding blocks
Use the Blocks button (top-right of the page, with the eye icon) to control which blocks appear in the current report.
- Click
Blocksto open the panel titledToggle block visibility. - Each block is listed with an eye toggle. Click a block's toggle to hide or show it.
- On save you will see a
Block visibility updatedconfirmation. The report redraws with your choice.
A block hidden here is excluded from the on-screen view and from exports of that report. If you hide everything, the report tells you no blocks are visible and points you back to the Blocks button.
The Directors division filter
The Directors tab adds a Division control above the report.
- Open the
Directorstab. - Use the
Divisiondropdown. It defaults toAll Divisions. - Choose a division to scope every block in the report to that division.
- If the division list itself cannot be loaded, the dropdown is disabled
and the filter says
Divisions could not be loaded, with a Retry control beside it. Retry re-requests only the division list.
That refusal is deliberate, and it is not the same as having no divisions.
A dropdown that stayed enabled while offering only All Divisions would
let you run a report, export it and file it believing your company has no
divisions to break out — with nothing on the screen saying otherwise. The
filter would rather refuse than offer you a choice list it knows is short.
4. Return to All Divisions to see the whole company again.
The chosen division also flows into the PDF and Excel exports of the Directors report, so an exported file matches what is on screen.
The Division filter appears only if your entity is set up with divisions. Single-division entities will not see it, and all reports simply show company-wide figures.
The Division Revenue table-or-chart toggle
On the Board report, the division revenue block offers its own view switch in the block header: Table and Chart. Click Chart to see the division revenue donut for the fiscal year, or Table to return to the numeric breakdown. This toggle affects only that one block.
Working with table blocks
The tabular report blocks — the division revenue breakdown and the other numeric tables in a report — render as sortable grids. Click a column header to sort by that column, and the header row stays frozen as you scroll a long table so the column labels remain visible. Sorting is a display convenience: it does not change the underlying figures or your saved layout.
Custom reports
Custom Reports, the sidebar item just below Analytics, opens the library of reports built with Arcvue AI — saved questions that run fresh against live data whenever they are opened. Ask the assistant for a chart or a table, press Save to library under the result, and it appears there. The Custom Reports guide covers sharing, exporting and deleting them.
Emailing a report
- Click
Email Report(top-right, envelope icon). TheEmail Reportdialog opens. - In
Recipient, enter the destination email address. This is required — sending with an empty recipient showsEnter a recipient email address. Subjectis pre-filled with the report name and current fiscal year. Edit it if you like.- Optionally add a message in
Note (optional). - Click
Send. On success you will see a confirmation naming how many recipients received it. ClickCancel(or the close control) to dismiss without sending.
The email always sends the report shown in the currently active tab.
Exporting to PDF or Excel
Two one-click exports render the current report exactly as configured, honoring your visible-block choices and, on Directors, the selected division.
- Click
Export PDFto download a PDF. Success showsPDF downloaded; a failure showsPDF export failed. - Click
Export Excelto download a workbook. Success showsExcel downloaded; a failure showsExcel export failed.
While an export is running, its button shows a spinner and is temporarily disabled.
Specialized workbook exports
Beyond the per-report PDF/Excel, the header hosts three purpose-built generators. Each opens a dialog, generates a .xlsx, and downloads it directly to your browser.
Contract Waterfall
Click Waterfall to open Generate Contract Waterfall. This produces a single sheet with contract metadata, annual revenue and gross profit per year, and monthly revenue detail across a year range.
- Set
Start YearandEnd Yearfrom the dropdowns to define the range. - Optionally check
Exclude completed contracts (only Active, Recompete, New Growth)to hide the per-contract detail rows for finished work. Their booked revenue stays in the totals. The option suppresses detail; it does not remove revenue the work actually earned, so the sheet still foots to the same number with the box ticked or clear. - Click
Generate Waterfall. On success you will seeWaterfall downloaded. UseCancelto close without generating.
Lender Model
Click Lender Model to open Generate Lender Model — a multi-target acquisition model funded by a single capital raise, populated live from your data.
- Optionally choose a source under the load-from-workspace dropdown. The default is
Manual entry; you can instead pick a saved deal or a multi-target evaluation to pre-populate the assumptions. When you pick a saved source, the structure and target count are set for you. - If your chosen deal has saved versions, a
Versiondropdown appears. It defaults to the latest; selecting an older version exports that snapshot and leaves live state untouched. - Choose a
Structure:Unitranche,Traditional,Senior + Mezz, orSBA. (Disabled when a saved source is driving the structure.) - Set
Number of Targets— one, two, or three simultaneous closes. - Set
Start YearandEnd Year. - Click
Generate Lender Model. On success you will seeLender Model downloaded.
Its form asks for three things:
| Input | What it does |
|---|---|
| Load from M&A Workspace | Pulls a modeled deal in rather than making you re-enter it. |
| Targets (ctrl/cmd-click for several) | Which growth targets to include — hold ctrl or cmd to pick more than one. |
| Close date — sets Year 1 of the projection | The label states the consequence: this date decides which year the projection calls Year 1. |
Close date is the input most worth getting right, because every year
label downstream is relative to it. A projection that looks shifted by a year
is almost always this field, not the model.
Audit Package
Click Audit Package to open Generate Audit Package — a prepared-by-client (PBC) list workbook with one tab per applicable item, generated dynamically from your ERP for the selected entities and period. The file streams directly and is not stored server-side.
- Set
Audit Year. It defaults to the prior calendar year. - Enter
Preparer Name. This is required. - Under
Entities, check the entities to include. Available entities load automatically for your tenant and are all selected by default, so a single-entity setup needs no clicks. At least one entity must remain checked. - Set
Period StartandPeriod End. These default to the calendar year of the audit year; override them for a non-calendar fiscal year. - Click
Generate Audit Package. On success you will seeAudit package downloaded. The generate button stays disabled until a preparer name is entered and at least one entity is selected.
The specialized exports depend on live source data — contracts, deals, and ERP entities. If the required data is not yet present for the range or entities you chose, generation can fail and the dialog will surface an error message. Adjust the range, entities, or selection and try again.