M&A Deal Evaluation & Modeling
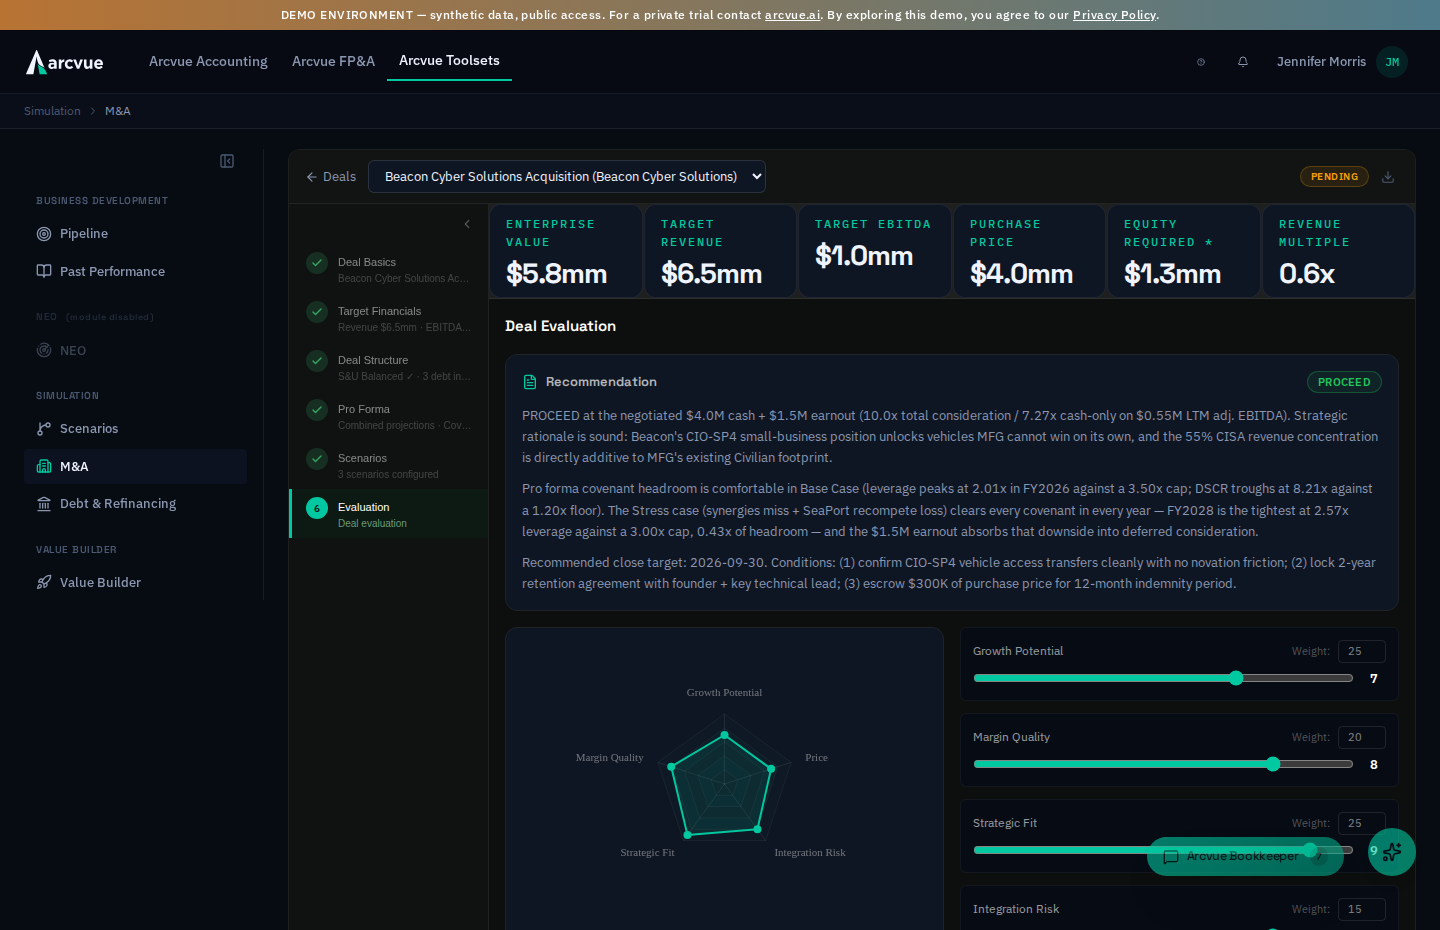
Model acquisition targets from screening through deal close, combining target financials, debt structure, earnout terms, synergies, and pro forma projections to stress-test covenant compliance and evaluate return scenarios.
Open the Module
In the left nav, open Toolsets > Simulation > M&A. You will see:
- The Deals view (card grid of all active M&A deals) when no deal is selected.
- The Staged workspace (six sequential workflow stages) when you select a deal.
Deal Manager: Create & Browse Deals
At the top of the Deals view, click Add Deal to open the New Deal drawer.
Create a New Deal
Target Name * is required — the asterisk is the form's own mark. Elsewhere
the deal picker reads Select a deal... until you choose one, and Cancel
backs out of the compare mode you are in rather than discarding a deal.
Fill in the quick-entry form:
- Target Name (required): Acquire target company name.
- Deal Type: Choose
Asset Purchase,Stock Purchase, orMerger. - Status: Select
Screening,LOI,Due Diligence,Closed, orPassed. - Purchase Price: Estimated cost.
- Target Close: Expected close date.
- Notes: Internal context (optional).
Click Create Deal to save. The new deal appears as a card in the grid.
Browse & Select Deals
Deal cards display:
- Deal name, target name, and status badge.
- KPIs: Purchase Price, Earnout, Revenue Multiple, EBITDA Multiple.
- Close date and target revenue footer.
Hover over a card to see a lift effect. Click to open the staged workspace. Use Compare Deals (top right) to enable multi-select mode, then check up to N deals and click Compare N Deals to see side-by-side metrics.
Each card also carries an export button and a trash icon, Delete deal. It asks first, naming the deal, because deleting it also removes its target financials, debt instruments, scenarios and earnout schedule, and it cannot be undone. Cancel backs out.
If the deal list cannot load, the page says Deals could not be loaded, which is not the same as having none, so reload rather than re-creating a deal. The analysis figures, scenarios, sensitivity matrix and deal comparison report a failed load the same way.
Tour Available: New to M&A? Click the Tour button (top right, Deals view) to walk through a live example with callouts on each stage.
Stage 1: Deal Basics
Define the purchase structure and transaction outline.
Fields You'll Enter
Equity Required * carries an asterisk because it is derived, not
entered — and it turns to an alert when it goes negative.
A negative equity requirement is not good news. It means the sources you have structured exceed the uses: the deal is over-funded and something in the structure is wrong. Less equity needed is the intuitive reading of a falling number and it is the wrong one here.
In the Deal Details card, set:
- Purchase Price: Total acquisition cost.
- Transaction Expenses: Legal, advisory, and closing costs.
- Close Date: Expected/actual close.
- Tax Rate (%): Corporate tax rate; default 20%.
- Exit Multiple (x): Multiple applied to terminal-year EBITDA for exit value. Leave empty to resolve per-scenario or per-covenant-year.
- Entry EBITDA Multiple (x): Purchase price ÷ trailing EBITDA. System derives this automatically when unset; save explicitly to lock it.
The KPI row shows real-time:
- Target Revenue, EBITDA, Asking Multiple (seller's ask), Entry Multiple (what you paid), Implied EV (= EBITDA × asking multiple).
How to Know It Worked
KPI cards populate with non-zero values. The Entry Multiple card shows either a derived hint ("Derived: 5.50") or your saved value. Save the deal by clicking Enter Target Financials → to advance — the advance control always names its destination, so what it says is where you are going.
Stage 2: Target Financials
Upload or model the target's historical and projected financials.
Add Target Financials
In the Target Financials table, each row is one fiscal year. For each year, enter:
- Revenue: Annual sales.
- GP %: Gross margin, typed as a percent — enter
40for 40%, not0.40. The field stores a fraction internally and renders it back to you as40.0%, so what you type and what you read are both percentages. (This guide previously said to enter a decimal. That was wrong: entering0.40gives you a 0.4% gross margin and a badly mispriced deal.) - Indirect: Operating expenses (SG&A, R&D, etc.).
- Adjustments: One-time items or normalization adjustments.
Computed columns auto-calculate:
- Gross Profit = Revenue × GP %
- EBITDA = Gross Profit − Indirect
- Adj EBITDA = EBITDA + Adjustments
A blank is unknown, not zero. A year with no GP % shows a dash for Gross Profit, EBITDA and Adj EBITDA rather than $0, and a blank Revenue or Indirect does the same to the figures built on it. Adjustments is the exception: it is optional, and a blank there counts as none.
Click a cell to edit; changes save on blur. Use the Export button to download the grid as Excel.
Historical Financials Panel
Below the target financials, review Historical Financials (2022–2024) per entity (Acquirer, Target A, Target B, etc.). This grid is editable:
The acquirer tab is labeled by the ma_acquirer_entity tenant setting only when the financial data actually carries that entity. A configured code matching nothing in the books resolves to the consolidated view, and the panel says so in an amber note under the title — consolidated numbers never render under a standalone label. When the setting names an entity the books do carry (a subsidiary booked standalone, say), the auto-populated cells come from that entity's own rows.
- Teal cells: Auto-populated from your accounting system's actuals.
- Blue cells: Edited (unsaved).
- White cells: Saved manual entries.
Switch entity tabs to toggle which entity you're viewing. Save each year independently using the Save 20XX button.
TTM Section
A Trailing Twelve Month (TTM) card appears if you have sufficient historical data. It shows:
- TTM Revenue, TTM EBITDA & margin %.
- Current Multiple (TTM EBITDA ÷ enterprise value at market rate).
- Market Multiple input (adjust the market multiple to see implied EV).
- Data Source (how many months of history backed the TTM).
How to Know It Worked
The Stage 2 summary updates to show: "Revenue $X M · EBITDA $Y M". Click Structure the Deal to advance.
Stage 3: Deal Structure
Remove instrument deletes one from the structure and reads Removing… while it works.
Specify sources of funds and their uses; add debt instruments and earnout provisions.
Sources & Uses
The Sources card lists the funding sources (equity, debt, seller note, etc.). The Uses card lists deployment (purchase price, transaction fees, working capital, etc.). Each line shows line_item and amount.
Balance is detected automatically:
- Green alert:
"Sources and uses are balanced."— you can advance. - Yellow alert:
"Sources and uses do not balance. Difference: $XXX"— fix the imbalance.
The balance is checked to the nearest dollar.
Sources & Uses is recalculated every time you save the deal, add, edit or remove a debt instrument, or change which instrument is the plug, so the cards always reflect the deal as it is now. A close date is required when you create a deal, because the existing debt to retire is read as of the close. When the sources fall short of the uses (for example a revolver too small for the gap), the difference shows as an imbalance; nothing is added to make the deal balance.
Add Debt Instruments
Each instrument carries its Term (yrs), and its schedule reads Beg. Balance through to End Balance per period — which is what you check when a covenant result surprises you, because the balance path is what the ratio is built on.
In the Debt Schedule section, click + Add Cash Source to create a new debt line item (initializes with rate = 0%, term = 0 years). Each instrument card shows:
- Instrument Name (e.g., "Senior Term Loan", "Mezzanine").
- Type Badge: e.g.,
Senior Debt,Revolver,Cash at Close. - Plug indicator:
"Plug ✓"(green) means this instrument's principal is back-solved by the engine. Click"Set as plug"to designate it. - Principal (large bold figure, amber).
- Metrics row: Interest Rate (%), PIK Rate (%), Term (years), Facility Cap.
- Amortization table: Period-by-period principal, interest, PIK, and ending balance.
Click Edit to modify a card's fields; click Save to persist.
Plug Mechanism
At the top of the Debt Schedule, a Plug Instrument selector shows:
- Dropdown: Choose which instrument (if any) the engine back-solves.
"No plug (manual mode)": Forces manual balance — you must hand-enter all principals.- When a plug is set, that instrument's principal field becomes disabled (locked, amber label:
"(plug — auto)"), and the engine computes its value as: Total Uses − sum of all other sources.
This allows you to model refinancing scenarios without rebalancing the Sources & Uses grid by hand each time.
Earnout Terms
Earnout Structure holds the tiers, each with its threshold and Amount ($). The projection columns show the Earnout Metric (Adj.) — the metric as adjusted, which is what the earnout actually tests, not the headline figure. The sensitivity card carries a Max Payout column so the worst case is visible beside the expected one.
In the Earnout Analysis tab (Stage 3 → Earnout Panel), set the payment structure:
- Metric Type:
Gross Profit,Adj. EBITDA, orRevenue. - GP Definition (if gross profit):
Gross GP,GP Net of Subs, orGP Net of ODCs. - Measurement Period:
Annual,Cumulative, orQuarterly. - Max Earnout ($): Ceiling on total earnout payout.
- Negotiated Threshold ($): Baseline amount before step-up schedule kicks in.
- Threshold Step ($): Dollar increment per step.
- Number of Steps: How many rungs in the payout ladder.
- Payment Timing:
Same Year,Following Year, or6-Month Lag. - Number of Earnout Years: 1, 2, or 3 years of earn-in.
- Carryforward (checkbox): If checked, missed earnout in one year carries forward to subsequent years.
- Carryforward %: appears once Carryforward is ticked, and decides how much of a missed year stays available later. The shortfall is recovered at the later year's own achievement — the measurement bar never moves — so 100% means a full miss can be earned back in full, and a lower number caps how much of it ever returns. Ticking the box without setting this field is not the same as turning carryforward on: the percentage is what carries.
Under Earnout Adjustments, add line items that modify the raw metric:
- Click any preset button — Sub Pass-Through Revenue, Management Compensation Normalization, and three more — to add that row with its direction and recurring flag already set. The amount starts at zero; type it in.
- Or enter a
+ Custom description, amount, direction (SubtractorAdd to metric), andRecurringflag (yes/no).
The Earnout Metric Trajectory table shows fiscal-year-by-scenario projections:
- Columns: Raw metric, adjustments applied, Earnout Metric (Adjusted) (in teal).
How to Know It Worked
Stage 3 summary updates: "S&U Balanced ✓ · N debt instruments". Click Run Pro Forma to advance.
Stage 4: Pro Forma & Goodwill
Two sub-tabs split Stage 4:
Projections & Goodwill
This is the read-only review surface. It shows:
Combined Projections Panel:
- Among the rows are Combined EBITDA% and Total Debt Payments — the margin the combination earns and what it owes out of it, read together.
- Adjust
Target Growth Rate(%) in the control at top. Acquirer defaults to 3%. - View the Projection table with columns for each year (stub years shown with month count).
- Rows include Acquirer Revenue, Target Revenue, Combined Revenue; Acquirer GP, Target GP, Combined GP & Combined GP%; Combined EBITDA & EBITDA%; Integration Costs, Earnout Payments, Debt Service, and Combined Net Income (bottom row, amber, bold).
Synergies Panel:
An inline-editable grid of value-creation opportunities. Click + Add row to add a synergy. Edit columns:
- Type:
Cost Savings,Revenue, orIntegration Cost. - Category: Free text (e.g., "SG&A consolidation").
- FY: Fiscal year impact.
- Amount: Dollar value.
- GM % (revenue synergies only): Gross margin % applied to revenue synergies to compute EBITDA contribution.
- Notes: Internal description.
The engine multiplies each synergy by the scenario's Synergy Realization % (see Stage 5) before including it in pro forma EBITDA.
Goodwill & Intangibles: If calculated, shows:
- Purchase Price, Allocated Fair Value (sum of identified intangible assets), Residual Goodwill (= PP − FV).
- A table of intangible assets: asset name, fair value, useful life (years or ∞), and annual amortization.
Target Profile (Stage 4, Sub-tab 2)
This is the operational target-state editor. It includes:
- Target Profile Editor: Define the standalone business profile post-integration.
- Target Backlog Panel: Capture pipeline, backlog, or growth initiatives. On a target with nothing captured yet the panel shows only + Add Backlog Data, which opens the editor with every figure at zero for you to fill. That button is the empty state — once any backlog exists it is gone, so if you are looking for it on a populated target, the data is already there and you want the edit controls instead.
- Pro Forma Revenue Composition: Pie charts by Division, Contract Type, Agency, Capability showing Acquirer (teal) vs. Target (amber) mix for Year 1.
How to Know It Worked
Both sub-tabs render without error. The projection table shows EBITDA, debt service, and net income rows. Click Run Scenarios → to advance.
The backlog panel labels one column differently
The Target Backlog Panel above carries its own ranked tables, and they use
the same shape as the diligence tables below with one difference worth knowing
before you go looking: its Prime-or-Sub column is headed Role, where the
diligence tables head the same distinction Prime / Sub. Same question, two
headings, one sub-tab. Its other columns read Bucket, Dimension,
Count, Rank, % of Total and % of Revenue, matching the
diligence tables.
Target Diligence (Stage 4, Sub-tab 2)
Below the target profile and backlog, five small tables record what the lender model prints about the target beyond its financials: Option-year risk (contract value riding on unexercised options, by bucket), Revenue cuts (revenue by fiscal year and dimension), Top customers, Top contracts and Vehicle mix. Edit a cell in place, use the row controls to add or remove rows, then click that section's Save -- each section is saved as a whole, and Save stays disabled until something has changed. Before this screen these tables could only be loaded by an engineer.
The columns are the lender's questions, not ours: Option-year risk carries Dollars at risk and Contracts in the bucket; Revenue cuts carries % of total; Top customers carries % of revenue; Top contracts carries Prime / Sub, which is Prime or Sub; and the ranked tables each open with a Rank you set yourself rather than one the table infers, so the order you intend is the order the model prints.
Stage 5: Scenarios
Model downside, base, and upside cases to stress-test the capital structure.
Create Scenarios
+ Add scenario creates one. On the tiled view it is drawn as a dashed-outline empty slot rather than a solid button — it reads as a gap in the layout, which is deliberate, but it is the control.
Each scenario is a what-if case. Scenario cards display:
- Scenario name (e.g., "Downside", "Base Case", "Upside").
- Description (if filled in).
- Scenario Adjustments section:
Target Rev Adj(% change to target annual revenue).Target Margin Adj(bps adjustment to target gross margin).Acquirer Rev Adj(% change to acquirer annual revenue).Acquirer Margin Adj(bps adjustment to acquirer gross margin).
Edit these fields (inputs show live); values save on blur.
-
Per-Year Overrides section: a table of fiscal years, each carrying a revenue growth and a GP margin override for this scenario only. + Year appends a row, dated the next year in sequence, with both overrides empty. An empty override is not zero — that year falls back to the scenario's flat
Target Rev AdjandTarget Margin Adjabove. Setting one replaces the flat adjustment for that year alone; the other years keep using it.Overrides do not cascade, and this is the one that will surprise YOU. Each override is applied to the prior year's stored revenue, not to the prior year's overridden result. So a single year's growth override does not reshape the run-rate after it — the following year goes back to compounding off the stored figures. To model a shock that persists, set an override on every subsequent year, not just the year it hits.
And this is not the per-year covenant schedule. That one is at the bottom of this stage, it is DEAL-LEVEL, and the guide says so — it is shared across every scenario. This one is scoped to the card you are in. If you want the downside case to grow more slowly than the base case, it is this table you want; editing the deal-level schedule moves all three at once, which is the mistake the two similar names invite.
-
Lender Modeling section:
Exit Multiple(scenario-level override; empty falls through to covenant year or deal default).Stressed Multiple(lender's downside exit used for LTV).LTV Ceiling(% maximum LTV).Synergy Realization %(haircut applied to all synergies; base = 100%).
-
Projected EBITDA footer: Terminal-year EBITDA for that scenario.
Pro Forma Revenue Composition (Year 1)
Where the combined revenue comes from, as a set of charts: By Division, By Contract Type, By Agency and By Capability.
A chart appears only for a dimension that has data, so a missing one means that dimension is empty on one side or the other — not that the breakdown is unavailable.
The colors carry the acquirer/target split deliberately — cool tones for your side, warm for the target's — so you can read how much of each slice is newly acquired without a legend.
Covenant Stress Test
The table carries an Exit (x) column — the exit multiple resolved for that scenario-year — and the goodwill schedule alongside carries Life (yrs), the useful life each intangible amortizes over.
Where a value has been overridden by hand, Remove override puts it back to the computed figure. The earnout sensitivity table's Flags column marks the cells worth a second look.
Save current state as new version snapshots the whole model, so a structure you are about to change can be returned to.
A cross-scenario, multi-year table showing:
- Leverage: Actual (scenario-year) vs. Max (covenant limit). Green ✓ if pass; red ✗ if breach.
- DSCR: Actual vs. Min. Green ✓ if pass; red ✗ if breach.
- LTV (if configured): Actual % vs. Cap. Green ✓ if pass; red ✗ if breach.
- Exit Multiple: Resolved via scenario > covenant year > deal (see tooltip).
Rows separate by scenario; faint borders within scenario years.
Per-Year Covenant Schedule
Below the stress test, edit Per-Year Covenant Schedule (deal-level, shared across all scenarios):
- FY (fiscal year).
- Leverage Max: Peak debt-to-EBITDA allowed in that year.
- DSCR Min: Minimum debt service coverage ratio.
- Exit Multiple: Multiple applied to terminal EBITDA for LTV/leverage math.
Click Save Schedule to persist changes.
How to Know It Worked
Covenant Stress Test table populates with no errors. Each scenario shows at least one year with covenant limits populated. Click Evaluate Deal to advance.
Reach it with Evaluate Deal → from Stage 5.
Stage 6: Evaluation
The Recommendation panel holds the written case for the deal, and the decision badge sits in its heading — the words and the verdict together, so neither is read without the other.
The decision you record here shows as a badge on the deal: Proceed in green, Renegotiate and Hold in amber, Pass in red.
Those four are the ones the platform styles, not the only ones it accepts. The decision vocabulary belongs to whoever set the deal up, and a value outside the four still renders — as a neutral chip, with its own text. So an unfamiliar badge is your own vocabulary coming back to you, not an error, and nothing you record here can silently vanish.
Weighted-score the deal vs. criterion, and compare to other opportunities.
Scoring Panel
On the left, a Radar chart plots:
- Growth Potential (25% weight default)
- Margin Quality (20%)
- Strategic Fit (25%)
- Integration Risk (15%)
- Price (15%)
For each criterion (right side):
- Weight: Adjust the importance (0–100, default sums to 100).
- Slider: Score 0–10 in 1-point increments.
- Score display: Large number on the right.
The Weighted Score (bottom of radar) updates in real-time. A weighted score above 7/10 typically indicates a strong candidate.
Compare to Other Deals
If you have multiple deals in the project, click Compare to Other Deals to open a modal showing: The modal is headed Deal Comparison and puts fourteen metrics side by side: Purchase Price, Target Revenue, Target GP%, Target EBITDA, EBITDA Multiple, Implied EV, Debt Required, Equity Required, Year 1 Combined EBITDA, Year 3 Combined EBITDA, DSCR Year 1, DSCR Year 3 and Payback Period.
Coverage is two rows, not one. DSCR Year 1 and DSCR Year 3 are reported separately because that is the comparison worth making — a deal that covers its debt service in year one and not in year three is a different deal from one that does the reverse, and a single averaged figure hides both.
Scores and weights persist to browser localStorage per deal ID.
How to Know It Worked
Radar chart renders with all five criteria plotted. Weighted Score displays as a single number (0.0–10.0) in teal. You can see the compare modal if 2+ deals exist.
Workflow Rails & Navigation
Stage Gating
Six stages unlock sequentially:
- Deal Basics: Always active (no gate).
- Target Financials: Unlocks when Stage 1 is saved (no gate on entry).
- Deal Structure: Unlocks when Stage 2 has >= 1 financial row.
- Pro Forma: Unlocks when Sources & Uses balanced.
- Scenarios: Unlocks after Stage 4 submission.
- Evaluation: Unlocks after Stage 5 submission.
Click any prior stage (1–5) to jump back and edit. Stage 6 is terminal (no advance button).
Header Bar
At the top of the workspace:
- ← Deals: Back to the deal list.
- Deal Selector: Dropdown to switch active deal.
- Status Badge: Current deal status (
Screening,LOI, etc.). - Export: Download the deal model as an Excel workbook.
KPI Cards (Right Rail)
Six KPIs display in the sidebar (collapse/expand via the rail toggle):
- Enterprise Value: Implied EV (target EBITDA × asking multiple).
- Target Revenue: Annual revenue assumption.
- Target EBITDA: Annual EBITDA assumption.
- Purchase Price: Deal price (from Stage 1).
- Equity Required (with alert indicator if negative — indicates too much leverage).
- Revenue Multiple: Purchase price ÷ combined Year 1 revenue.
Export & Versioning
Export to Excel
Click the Export button (top right) to download a workbook with sheets:
- Target Financials table.
- Debt schedule and amortization.
- Scenarios and covenant schedule.
- Synergies.
- Combined projections.
File name: Arcvue_MA_[DealName].xlsx.
Deal Versions (Snapshots)
Click Save version (top right, near Deal Selector) to snapshot the current live state:
- Enter an optional version label (e.g., "v1 — Final Diligence").
- Click
Save version. A new immutable record is created.
All deal-scoped tables are captured (target financials, scenarios, synergies, sources & uses, covenants, debt structure). Your accounting system's historical financials are NOT snapshotted (you can reload them at any time).
To restore a prior version:
- Open the Load version… dropdown (appears if versions exist).
- Select the desired version.
- Confirm the restore dialog. This overwrites the live state with the snapshot.
Multi-Target Evaluations
An evaluation combines several targets into one lender model, for a transaction where more than one company closes together. It lives on the M&A page below the deal list, under Multi-target evaluations.
- New evaluation names the case and ticks its targets. Save is available once it has a name and at least one target.
- Evaluation setup holds the close mode, the close date that starts year one,
and four assumptions: Combined tax rate (%), Net working capital (% of
revenue), Capital expenditure (% of revenue) and TTM EBITDA override
($). Empty assumptions fall back to each deal's own. The card saves as a
whole once something changed.
- The close mode is stated in full rather than as one word, because the two behave differently: Simultaneous: every target closes on the close date, or Staggered: targets close in sequence from the close date.
- Covenant schedule is one row per fiscal year the lender tests, and its columns are Max leverage, Min DSCR and Max senior leverage, each in multiples. Empty cells are not tested — a blank is not a zero — and a fiscal year entered twice is refused.
- Combined debt stack is the financing at close: the instrument's type, name, principal, cash and payment-in-kind rates, commitment fee, facility cap, term, and whether the row is the plug or a revolver. The types offered are Senior Debt, Unitranche and Subordinated Debt. Exactly one instrument may be the plug; the engine sizes its principal to balance sources and uses.
- Delete asks first — Keep backs out — then removes the evaluation with its schedule and stack. The deals themselves are untouched.
Reporting's lender-model export offers every saved evaluation in its source dropdown, so what you enter here is what that export prints.
Common Workflows
Quick Deal Screening
- Create deal (name, type, status, rough purchase price).
- Stage 1: Fill in deal details (close date, tax rate, exit multiple).
- Stage 2: Enter 2–3 years of target financials (revenue, margins).
- Stage 3: Balance Sources & Uses with equity + one debt facility.
- Jump to Stage 6: Score the deal. Done.
Full Deal Model
- Stages 1–3: Complete deal basics, full 3–5 year financials, multi-tranche debt structure, earnout terms.
- Stage 4: Model synergies (SG&A cuts, revenue cross-sells, integration costs).
- Stage 5: Create 3 scenarios (Downside 70% rev, Base 100%, Upside 120%), set covenant maximums per year.
- Stage 6: Score against peers; export to Excel for board presentation.
Sensitivity Testing
- Open Stage 5 and duplicate a scenario (or edit existing).
- Change
Synergy Realization %(e.g., 50% downside vs. 100% base). - Watch the Covenant Stress Test table update in real-time.
- Check which years fall into breach (red cells).
Earnout Payout Analysis
- Stage 3: Configure earnout metric (e.g., Adj EBITDA with 500K threshold, 4 steps, $500K per step, 2 years earn-in).
- Add adjustments (sub pass-through, mgmt comp, etc.).
- Stage 5: Create scenarios with different revenue/margin adjustments.
- Earnout Panel → Sensitivity Matrix: Click cells to see cash flow impact (total payout, leverage at payment, DSCR, cash available after earnout).
Terminology & Labels
- Asking Multiple: Seller's valuation multiple (entry point for negotiation).
- Entry Multiple: Actual purchase price ÷ trailing EBITDA (what you paid).
- Exit Multiple: Terminal-year multiple used to compute exit value for LTV/leverage.
- Synergy Realization %: Haircut applied to all synergies per scenario (e.g., downside = 50%, base = 100%).
- Plug: Instrument whose principal is auto-solved by the engine (balances Sources & Uses).
- Covenant Breach: Leverage exceeds max OR DSCR falls below min OR LTV exceeds cap.
- TTM: Trailing Twelve Months (rolling 12-month financial snapshot from actuals).
Tips & Gotchas
Synergy realization cascades: Synergies are multiplied by the scenario's realization % before feeding into EBITDA. A downside scenario at 50% realization will show 50% of each synergy's benefit. Adjust per-scenario to stress-test conservatively.
Exit multiple resolution order: Scenario → covenant year → deal level. If your scenario doesn't specify an exit multiple, it falls through to the per-year covenant schedule. If that's empty, it uses the deal default (Stage 1). Always fill in at least one level to avoid "—" in the Covenant Stress Test.
Plug principal is disabled: When an instrument is the plug, you cannot manually edit its principal. The engine auto-calculates it. To return to manual mode, change the Plug Instrument dropdown to "No plug (manual mode)".
Sources & Uses balance checked to $1: A difference < $1 is treated as balanced (floating-point tolerance).
Restore versions are destructive: A restore immediately overwrites all live data with the snapshot. If you have unsaved edits, save them as a new version first.
How to Know It Worked
- Deal list loads: Multiple deal cards appear with KPIs populated. Clicking a deal opens the staged workspace.
- Stages render: All six stages load without errors; KPI cards in the rail show live updates as you fill in fields.
- Projections compute: Stage 4 → Combined Projections shows rows for revenue, EBITDA, earnout, debt service, and net income with no "NaN" or error messages.
- Export generates: Clicking Export creates an Excel file with labeled sheets (no empty sheets; all tables render).
- Covenant stress test populates: Stage 5 table shows leverage, DSCR, and (if configured) LTV compliance per scenario-year, with green/red badges.
Related
Financial Statements — View company-wide P&L, Balance Sheet, and Cash Flow (FPA > Financial Intelligence > Financial Statements).
Treasury — 13-week cash forecast and debt covenants (FPA > Financial Intelligence > Treasury).
Scenarios — Multi-period what-if analysis for the acquirer (Toolsets > Simulation > Scenarios).
Debt & Refinancing — Detailed debt schedule builder and refinancing scenarios (Toolsets > Simulation > Debt & Refinancing).
Value Builder — M&A valuation diagnostic and sensitivity (Toolsets > Value Builder).