My Programs & Program Performance (PMR)
Two questions come up constantly when you run contracts: how are my programs doing right now? and what's actually happening inside this one contract? Arcvue answers them with two connected views — My Programs, a division-scoped health dashboard you scan in seconds, and Program Performance (PMR), a cost-report deep-dive you open on a single contract or a group. This guide covers both, and — because the most common question about this area is simply where do I find it — it starts by making the map clear.
Who uses it: program managers, division leads, and leadership who own contract performance. What you see is scoped to your role: leadership sees every division; division leads and PMs see the contracts in their own division.
Finding it — which view do I want?
There are three related surfaces, and it's easy to reach for the wrong one. Here's the map:
| I want to… | Go to | Where it lives |
|---|---|---|
| Scan the health of all my programs at once (revenue, margin, backlog, what's expiring) | My Programs | FP&A → Financial Intelligence → My Programs (briefcase icon) |
| Deep-dive one contract's cost report — revenue, labor, ODC, margins across time windows | Program Performance (PMR) | Opened from Contracts — see below |
| Work the full contract list — edit, filter, manage the portfolio | Contracts (Contract Portfolio) | Operations → Contracts |
My Programs is at FP&A → Financial Intelligence → My Programs. It is not the default landing page (the Dashboard is), so if you've never found it, that's why — look for the briefcase icon in the Financial Intelligence group of the left nav.
Program Performance (PMR) is not reached from My Programs — you launch it from Contracts. Open the Contracts list, and on any contract row click the Performance (bar-chart) icon; PMR opens full-screen for that contract. To compare several contracts, multi-select rows and choose View Performance — PMR opens on the group with a per-contract breakdown.
My Programs — the health dashboard
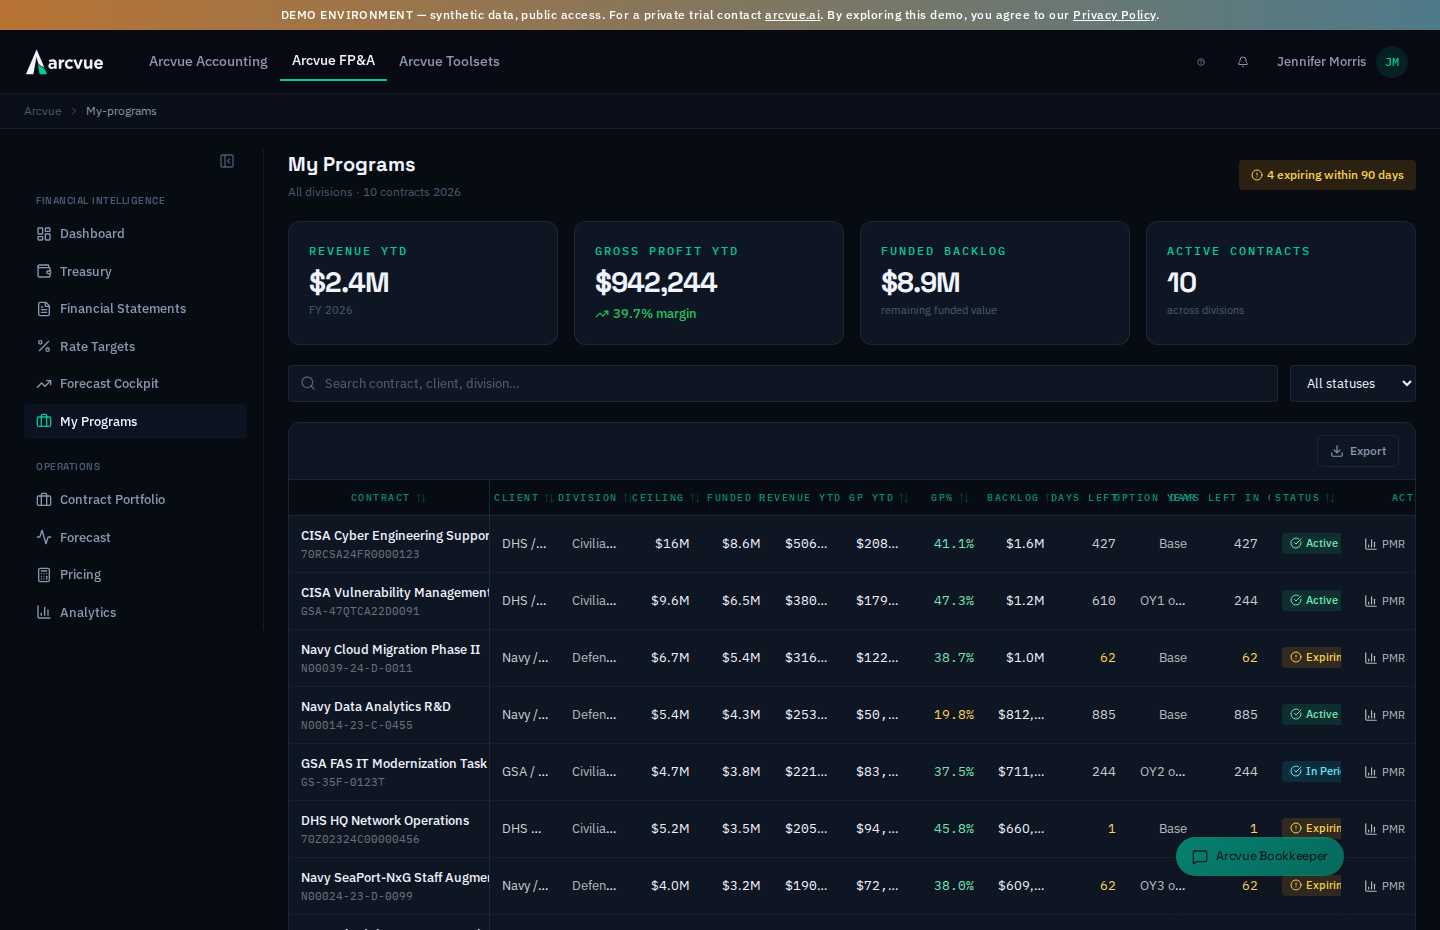
One screen, scoped to your division (leadership sees all). Four KPI cards summarize the year:
- Revenue YTD — revenue booked this fiscal year across your programs.
- Gross Profit YTD — year-to-date gross profit, with the margin percent alongside.
- Funded Backlog — remaining funded value still to be earned: funded value minus inception-to-date revenue. Note it is revenue, not billings — the two differ by unbilled work, so this is what you have left to earn rather than what you have left to invoice.
- Active Contracts — how many programs are in scope.
If any contract's period of performance ends within 90 days, a banner flags how many are expiring soon so nothing lapses unnoticed.
Below the cards, a searchable table lists every program. Search matches contract name, number, client, or division; the status filter narrows to Active, In Period, Expiring Soon, or Expired. Each row shows the contract and number, client, division (when you're viewing across divisions), ceiling and funded value, Revenue YTD, GP YTD and GP% (color-coded — green at healthy margins, red when negative), remaining backlog, days left on the period of performance (amber inside 90 days, red once expired), the current Option Year (e.g. OY2 of 3, or Base of 3 during the base period), Days Left in OY (days remaining in the current option period, amber inside 90 days, red once elapsed), and a status badge.
The status badge, the filter, and what they do not tell you
The filter's unset state is All statuses; the values it offers are Active, In Period, Expiring Soon and Expired.
Every one of those is derived from days left on the period of performance, and nothing else. Expired is past its end date, Expiring Soon is inside 90 days, In Period is inside a year, Active is beyond that. So a green Active badge means the contract runs for a while yet — it does not mean the program is doing well. A program can be Active and losing money, and the badge will not say so. Read GP% for that, never the status.
Unknown means the contract record has no period-of-performance end
DATE. It is a fact about the record, not about the work — nothing is wrong
with the program, we simply cannot compute a days-left for it. It is worth
chasing, because that one missing date also empties Days Left, Option Year and
Days Left in OY on the same row.
And the one to know: the filter has no Unknown option, so there is no
way to narrow to those rows. They appear only under All statuses —
pick All statuses and sort or search rather than expecting a filter for
them.
Actions holds two buttons that behave differently, which is worth knowing before you click: PMR opens Program Performance over this screen and closing it returns you here, while Forecast navigates away to the forecast editor for that contract. One stays, one leaves.
A third button, Estimate, appears on a contract you are assigned to as its Program Manager -- and, for a Division Lead, on every contract in their division. It opens that contract's estimate at completion, spend plan and management reserve beside the table -- the same panel the contracts office works in -- where you record your estimate and percent complete, adjust the spend plan, and authorize or draw reserve. Closing it returns you here. If a contract you run shows no Estimate, it is not yours to change: an administrator assigns a Program Manager's contracts with Limit which contracts this user can see on the user, and sets a Division Lead's division on theirs.
On the same contracts, Hours opens the hours budget: the hours you give each person on each contract line for the contract year, against the hours they have used, read from timesheets and the subcontractor portal as they are entered. Set a budget per person and line, open any person's days on that contract, and download the monthly report by line. The Hours Budget guide for managers walks it.
Program Performance (PMR) — the deep-dive
PMR opens full-screen on the contract (or group) you launched it from. At the top, an as-of month/year scrubber sets the point in time everything is measured through — move it to see the program as of any prior close.
Everything below is shown across four time windows:
| Window | Covers |
|---|---|
| MTD | The as-of month |
| T3M | Trailing 3 months |
| T6M | Trailing 6 months |
| TTM | Trailing 12 months |
- KPI cards — for each window: revenue, gross profit, and GP% (with the variance against budget when a budget exists).
- 24-month trend — revenue bars with the GP% line overlaid, so you can see the trajectory, not just the latest number.
- Cost Report Detail — the full line-item cost report (revenue, labor, ODC, fringe, overhead, G&A, the margin subtotals) down the side, the four windows across the top. When your accounting system supplies budgets, each window also shows Actual vs Budget vs Δ. Two drill-downs live on this grid:
- Click any currency figure to open the transactions behind that cell — what is on the line, plus a "charged to this project, not on this line" section that names cost your ERP's project report carries but this line correctly does not (coded to an indirect account, or posted after the close), with a CSV export.
- Click a Total Hours Worked figure to open Hours by Person — hours charged to the contract, by individual and month. It answers is someone burning through their hours: a person under full-time shows their % FTE and h/wk scheduled straight off the roster, the All hours row totals each month, and the Total column totals each person. A toggle switches between Calendar year and Contract year — the contract's current funded Base or Option period, resolved from the dates on the contract record and named exactly (a contract with no recorded period dates says so and names the fix; a multi-contract selection offers the calendar view, since two contracts have two different option years). Hours are as entered on timecards — including entries not yet approved, so the current month is visible — with the latest charge date stated; indirect time (PTO, holiday, overhead) is never charged to a contract and never appears.
- Service Contract Act labor has its own lines. Direct Labor is the labor the Act does not cover and Direct Labor SCA is the rest; together they make Labor Total. Fringe burdens Direct Labor at your non-SCA fringe rate and Fringe SCA burdens Direct Labor SCA at your Fringe (SCA) rate, so a contract staffed under the Act carries its own fringe rather than the non-SCA rate. Overhead and G&A still apply to total labor and both fringe lines.
- Blank margin rows. When no cost was attributed to the program for a period, that period's margin rows are left blank and a note above the grid says so: a margin computed from revenue alone would read as nearly 100%. On a group, one contract with revenue and no direct cost in the period is enough, since blending it in would count all of its revenue against the other contracts' cost. Revenue and any cost that did post still show.
- Per-contract breakdown — when you opened PMR on a group, an expandable section shows each contract's contribution (revenue, cost, GP, GP%) so you can see who's driving the group's numbers.
What GP % means on PMR — and what it is not
GP % and Gross Profit on every PMR surface are above-fringe gross
MARGIN: (Revenue − Labor Total − Total ODC) ÷ Revenue. The KPI tile, the
Cost Report Detail grid, the 24-month trend and the contract-overview column all
describe the same number, deliberately, so the figure does not shift meaning
as you move around the screen.
Net Margin is a different row and the two are not interchangeable.
Net Margin sits further down the detail grid and carries the indirect burden
that GP does not. Quoting one where the other is expected changes the answer,
which is why the two are named separately rather than left to context.
Line item is the first column of the Cost Report Detail grid — the cost report's own rows down the side, with the four time windows across the top. It stays pinned as you scroll sideways, so you never lose which row you are reading.
When a comparison column appears it is Budget if budget data exists, and
Forecast only when it does not. You do not choose which one you get —
the data decides. So a window showing Forecast is telling you there is no
budget loaded for it, not that someone selected a forecast view.
Export CSV sits in the footer of the transaction drill-down, beside the line naming where the figures came from — export what you are looking at rather than re-querying it elsewhere.
The Hours window toggle in the header of Hours by Person is the Calendar-year / Contract-year switch described above. The two answer different questions and neither is a default worth assuming: calendar year is how the business reports, contract year is how the funding is actually consumed — so a person who looks fine against the calendar can be well ahead of the contract period the hours are charged to.
How the numbers are built
A few conventions explain what you're reading.
Gross profit is measured "above fringe." PMR defines gross profit as revenue minus direct labor minus other direct costs (ODC) — before fringe, overhead, and G&A. This is deliberate: it's a clean operational read on how a program is performing that doesn't move around with how your indirect rates happen to be allocated. The cost report also shows margins after fringe and net margin further down, so you get both the operational and the fully-burdened picture.
Everything runs through your last closed month. Figures are actuals through the most recently closed accounting period; unbilled future months show blank rather than a guess. Move the as-of scrubber back and you'll see the program exactly as it stood at that close.
Backlog is funded value minus inception-to-date revenue — recognized revenue, not amounts invoiced. Once a contract's period of performance ends or it goes inactive, its backlog reads zero.
Budgets and plans depend on your accounting system. The budget and plan-to-complete columns appear when your connected accounting system provides them; otherwise PMR shows actuals only — still complete, just without the budget comparison.
What PMR helps you catch
Beyond the per-contract cost report, the program-performance analytics surface three operational signals across your portfolio (available in the Contracts performance views):
- Recompete maturity — contracts approaching the end of their period of performance, weighted by how much revenue they run, so the big recompetes don't sneak up.
- Margin trend — programs whose gross margin has moved materially over the last quarter versus the prior one, flagged against a threshold you set.
- Funding and burn — programs burning toward the edge of their funded runway, and programs whose backlog will outlast the period of performance.
Roles & what you see
Leadership roles (CEO, COO, CFO, admin, and the finance / growth / operations leads) see every division. Division leads and program managers see the contracts in their own division. The scoping is applied automatically from your role — you don't set it — and it fails closed, so you never see a division you're not entitled to.
Troubleshooting
- I can't find My Programs. It's in the left nav under FP&A → Financial Intelligence, marked with a briefcase icon — not on the default Dashboard. If the whole section is missing, your tenant may not have the FP&A module enabled (ask an admin).
- A contract is missing from PMR / there's a "contracts excluded" warning. PMR needs the contract linked to its project in your accounting system to pull a cost report. The coverage banner tells you how many were excluded for lack of that link.
- The budget columns are empty. Budget and plan data comes from your connected accounting system; without it, PMR shows actuals only.
- Future months are blank. That's intentional — figures stop at your last closed month rather than projecting unbooked periods.
- PMR numbers differ from a contract's Job Summary. They shouldn't for the same window — both use the same above-fringe gross-profit derivation. If they differ, check that the as-of period and contract selection match.
- The Job Summary says it couldn't load, and offers Retry. The request did not complete. The KPI cards and the grid show nothing rather than zeros until it does, and the 24-month trend and the per-contract breakdown each report their own failed request the same way. Click Retry to re-run just that request. That is a different state from No revenue activity in the trailing 24 months for this selection or No per-contract data in the selected window, which mean the request came back and the window really holds nothing.
Related pages
- Contracts — the full contract portfolio (edit, filter, manage); this is also where you launch Program Performance (PMR) from a contract row.
- Dashboard — the executive roll-up; My Programs is the division-level view beneath it.
- Financial Statements — the company-wide P&L and balance sheet that these program-level numbers roll up into.