Scenario Planning — User Guide
Purpose
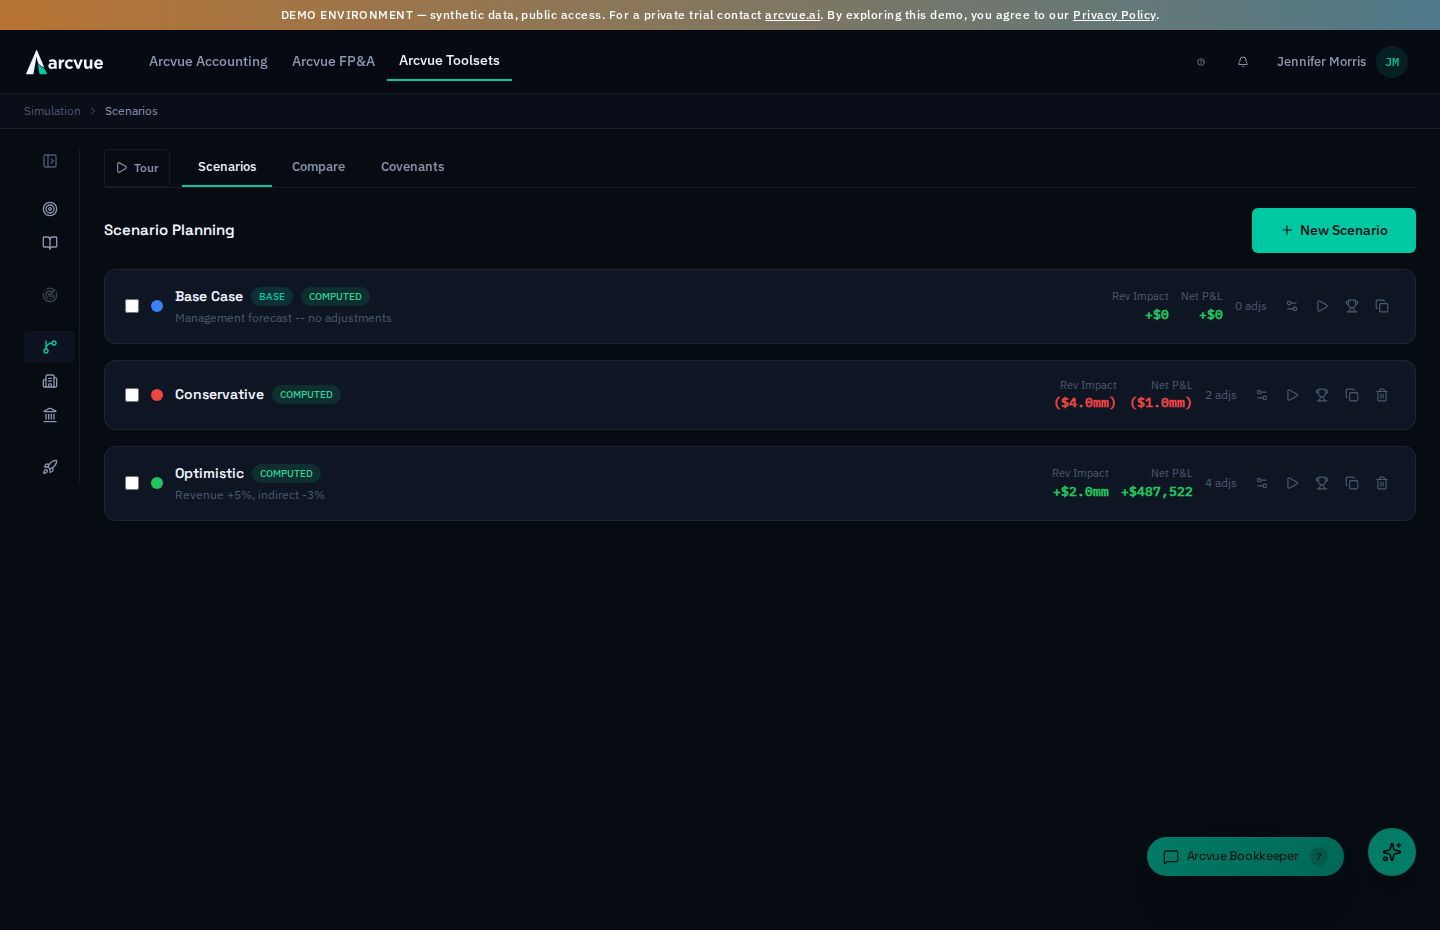
Scenario Planning lets the CEO and COO model "what-if" scenarios as overlays on the live base forecast. Scenarios never modify actual forecast data — they apply percentage changes, dollar overrides, and rate adjustments to see how changes would impact the P&L, covenants, and cash position.
Who uses it: CEO (R/W all + base case recompute), COO (R/W own scenarios, R/O on CEO's, can duplicate), CGO (R/O). Division Leads and Growth Support have no access.
Key Concepts
Overlay Architecture
- Base Case = Live forecast data from
pl_forecastsand actuals (untouched) - Scenario = Named set of adjustments (% changes, dollar overrides, rate overrides)
- Scenario Result = Base Case + Scenario Adjustments (computed per fiscal year)
- Scenarios are non-destructive — deleting a scenario has zero impact on the base forecast
Adjustment Types
There are thirteen adjustment types organized into six categories. Ten of them are entries in the Add Adjustment dropdown on the Scenarios page. An eleventh is Revenue Change with its Change Type set to Dollar ($), and the remaining two come from the Cockpit's Save as Scenario. See Where each lever comes from below.
A lever applies to every forecast year unless you give it a Fiscal Year. Most types carry that field; a blank applies the lever to every year, and a year confines it to that year. Revenue Change has no Fiscal Year field, so it always applies to every forecast year at the full amount.
Revenue Levers:
- Revenue Change (
revenue_pct) — the dropdown entry. Percentage increase or decrease to total revenue. Direct costs scale proportionally, preserving the base case gross profit margin. Example: -20 = 20% revenue reduction. - Revenue Change → Change Type: Dollar ($) (
revenue_dollars) — the same dropdown entry with itsChange Typeselect set toDollar ($). There is no separate "Revenue $ Change" in the type list, so look for it inside Revenue Change rather than beside it. Fixed dollar change to revenue (in thousands). Direct costs scale proportionally. Example: -5000 = $5M revenue reduction. - Both forms of Revenue Change also show
Start MonthandEnd Month. The engine does not read them, so they do not bound the change (see Fields the form collects that the engine does not read).
Contract Scenarios:
- New Contract Win (
contract_win) — Model winning a pipeline opportunity or a manually entered contract. Revenue and costs are time-aware: only months within each fiscal year count. Two input modes: From Pipeline (auto-populates ceiling, duration, start date from pipeline_opportunities) or Manual Entry (user enters all fields). User specifies expected GP margin since pipeline data lacks cost detail. The engine prorates monthly revenue (ceiling / months) across fiscal years based on start date. Direct costs use the specified margin rather than the base case margin. - Contract Loss (
contract_loss) — Model losing one or more existing contracts. Multi-select dropdown of active contracts with forecast data. For each contract, choose loss timing: end of PoP or a specific date. The engine reads actual forecast_data (revenue + all 5 cost categories) and removes them from the loss date forward. Supports multiple simultaneous losses (e.g., "lose Navy AND Air Force"). Unlike the % levers, this uses exact per-month forecast data, not estimates.
Workforce & Pricing:
- Indirect Headcount Change (
headcount) — Model adding or cutting INDIRECT staff; direct billable heads are modeled through the contract levers, not here. SetChange TypetoAdd HeadcountorRemove Headcount, then enterNumber of Heads,Avg Loaded Cost ($)per head (the form defaults to 100,000), and aStart Month. The impact lands on operating income and is prorated from the start month across each fiscal year — adding heads reduces income. The stored value is already signed, so a removal is negative. Example: 3 heads at $180,000 loaded cost from 2026-07 charges $270,000 (6 of 12 months) in FY2026 and $540,000 in FY2027. - Pricing Change (
cost_adjustment) — An annual cost change in dollars, where a positive value means costs go UP. Enter the amount and anEffective Month; the engine prorates it (amount / 12 × active months) in the effective year and applies the full amount in every later year, since a pricing change has no end date and persists until superseded. Example: 120000 effective 2026-07 adds $60,000 of cost in FY2026 and $120,000 in FY2027.
Growth & Market:
- M&A Acquisition (
ma_acquisition) — Model an acquisition. EnterTarget Name,Acquisition Date,Target Annual Revenue ($),Target GP %(form default 30),Purchase Price ($)andIntegration Cost ($). The target's revenue and its cost are added after the base direct-cost scaling is fixed, so an acquisition does not scale our direct labor base or cascade our fringe rates — the acquired staff's cost is already insideTarget GP %.Integration Costis charged once, in the acquisition year.Purchase Priceis deliberately not charged to operating income: it is consideration for an asset, not an operating expense, and charging it here would understate operating income by the entire deal value in year one. Financing consequences belong to the Debt module. With noAcquisition Datethe lever contributes nothing, because there is no year in which to place either the revenue or the one-time charge. - Market Condition (
market_condition) — A broad shift applied to the base case. Enter aCondition Name, thenRevenue Impact (%)andCost Impact (%). Both are percents, not decimals. The revenue impact scales base revenue and the cost impact scales base direct costs. Example:Revenue Impact-5 withCost Impact2 models a 5% revenue haircut alongside a 2% direct cost increase. The form also showsStart Month,End MonthandValue (primary %); the engine reads none of them.
Indirect Cost Levers (non-overlapping):
- Indirect Labor % Change (
indirect_labor_pct) — that is the label in the Add Adjustment dropdown. Percentage change to indirect labor (7x accounts) only. Triggers a fringe cascade (see below). Does NOT touch fringe, FAC, indirect expense, or unallowable. Example: -10 = 10% IL reduction. The form'sPoolandEffective Monthare not read: the change applies to all indirect labor, for the whole of each year it covers. - Indirect Non-Labor % Change (
other_indirect_pct) — Percentage change distributed proportionally across non-labor, non-calculated indirect categories: Facilities (FAC), Indirect Expense (G&A), and Unallowable. Fringe and Bonus are excluded because they already auto-adjust via their own mechanisms (labor cascade and GP change respectively). Distribution is based on each category's share of the discretionary indirect base. Example: -10 = 10% reduction across FAC, G&A expense, and unallowable.
Override Levers:
- Bonus Pool Change (
bonus_override) — Fixed dollar change to the bonus pool vs base case (applied to G&A Award 81.51.11). Replaces the automatic GP-driven bonus recalculation — it does not stack on top of it. Multiple bonus adjustments accumulate (stack with each other). When no bonus override is set and revenue changes, the bonus pool auto-adjusts based on the GP impact (CGO 4% of new business GP change + minor growth bonus scaling). Example: -500000 = $500K bonus reduction. - Fringe Rate Override (
fringe_rate_override) — Override the Non-SCA fringe rate used for cascade calculations. Acts as a multiplier (new rate / base rate) on Non-SCA fringe. Useful for modeling scenarios like switching to a high-deductible health plan. Value is a decimal rate, e.g., 0.085 for 8.5%. The current base rate is visible in Indirect Rates underfringe_rate_non_sca. - One-Time Item (
custom_item) — Direct dollar adjustment to net income. Bypasses all P&L line items and hits NI directly. Use for one-time items that don't fit other categories. Example: -100000 = $100K NI reduction.
Where Each Lever Comes From
Not every lever is created from the Scenarios page. All thirteen are computed identically once they exist — this table is about where one is authored.
Lever (adjustment_type) | Created from |
|---|---|
Revenue Change (revenue_pct) | Scenarios dropdown, and the Cockpit Save as Scenario handoff (per-division growth dials) |
New Contract Win (contract_win) | Scenarios dropdown |
Contract Loss (contract_loss) | Scenarios dropdown |
Indirect Labor % Change (indirect_labor_pct) | Scenarios dropdown |
Pricing Change (cost_adjustment) | Scenarios dropdown |
Market Condition (market_condition) | Scenarios dropdown |
Indirect Headcount Change (headcount) | Scenarios dropdown |
M&A Acquisition (ma_acquisition) | Scenarios dropdown |
One-Time Item (custom_item) | Scenarios dropdown |
Fringe Rate Override (fringe_rate_override) | Cockpit Save as Scenario (the SCA and Non-SCA fringe dials) |
Other Indirect % (other_indirect_pct) | Cockpit Save as Scenario (the G&A and overhead rate dials) |
Bonus Pool Change (bonus_override) | Scenarios dropdown |
Revenue $ Change (revenue_dollars) | Scenarios dropdown — Revenue Change with its Change Type set to Dollar ($) |
The API rejects any adjustment_type outside this set with a 400 rather than
accepting it and returning an unchanged base case.
Fields the Form Collects That the Engine Does Not Read
Several levers collect a scope that is not yet honored, because the base P&L is consolidated and no lever is division- or contract-scoped. The fields are persisted and shown back, so a scenario keeps the operator's intent on the record, but they do not change the computed answer:
| Field | On lever | Effect today |
|---|---|---|
Start Month, End Month | Revenue Change, Market Condition | Not read. The change applies in full to each year the lever covers: every forecast year, or only its Fiscal Year when one is given. |
Value (primary %) | Market Condition | Not read. On save it is replaced by Revenue Impact (%) whenever that is non-zero; the engine reads Revenue Impact (%) and Cost Impact (%) only. |
Pool, Effective Month | Indirect Labor % Change | Not read. The change applies to all indirect labor for the whole year. |
Contract | Revenue Change, Pricing Change | Informational — the change is applied company-wide. Only Contract Loss reads its contract. |
Division | New Contract Win | Informational for the computation; it seeds the GP % default from that division's target margin. |
Purchase Price | M&A Acquisition | Deliberately excluded from operating income (see above). |
Category | One-Time Item | Not read. The item lands at operating income whichever category you pick, so it moves net income and EBITDA either way. |
Honoring the scope fields requires division-scoped projections, which is a substantially larger change than the levers themselves. Until then, read a scoped lever as company-wide.
Revenue → Direct Cost Scaling
When revenue is adjusted, direct costs scale proportionally to maintain the same gross profit margin percentage. The DL/subcontractor/ODC/travel mix is preserved based on the base case cost composition. This ensures realistic scenario modeling — a 20% revenue drop produces a 20% direct cost drop with the same cost structure.
Fringe Cascade (Proportional Labor Base Scaling)
Fringe costs scale proportionally to changes in their underlying labor base, not by multiplying a delta against a parameter rate. The engine splits fringe into two components with separate labor drivers:
- Non-SCA Fringe (accounts 61.xx + 62.xx) — Driven by Non-SCA labor base: Direct Labor Non-SCA (51.11.11) + Indirect Labor for fringe (71.11.11, 81.11.11, 81.11.20, 85.11.11, 86.11.11, excluding bonus accounts like 71.51.11)
- SCA Fringe (accounts 63.xx + 64.xx) — Driven by SCA labor base: Direct Labor SCA (52.11.11)
The fringe cascade triggers when:
- Revenue changes cause DL to scale (both Non-SCA and SCA DL scale with DC)
- Indirect Labor % Change adjusts IL (only affects Non-SCA labor base)
- Fringe Rate Override changes the effective rate (only affects Non-SCA fringe)
Facilities (FAC) costs (66.xx — rent, network support, utilities, repairs) are NOT part of fringe and do NOT scale with labor. They are held constant unless an Other Indirect % Change is applied.
Non-Overlapping Indirect Levers
The indirect cost levers are deliberately non-overlapping, with calculated items isolated from discretionary items:
| Lever | What It Touches | What It Excludes |
|---|---|---|
| Indirect Labor % Change | 7x accounts only | Fringe, FAC, IE, UA, Bonus |
| Indirect Non-Labor % Change | FAC, IE, UA only | IL, Fringe, Bonus |
| Fringe Rate Override | Non-SCA fringe (61+62) | Everything else |
| Bonus Pool $ Change | G&A Award (81.51.11) | Everything else |
Calculated items (Fringe and Bonus) are never included in the blanket percentage levers because they already have their own auto-adjustment mechanisms:
- Fringe auto-scales proportionally when DL changes (via revenue) or IL changes (via IL lever)
- Bonus auto-adjusts when GP changes (via revenue), unless explicitly overridden
This means "drop all indirects by 10%" is achieved by setting IL -10% and Non-Labor -10%. Fringe will cascade from the IL change, and bonus will auto-adjust from any GP change. No double-counting.
P&L Line Item Structure
The scenario P&L comparison displays these line items:
| Line Item | Source | Scenario Behavior |
|---|---|---|
| Revenue | All 4x accounts | Adjusted by revenue levers |
| Direct Costs | All 5x accounts | Scales proportionally with revenue |
| Gross Profit | Revenue + DC | Derived |
| GP Margin | GP / Revenue | Preserved when only revenue changes |
| Indirect Labor | All 7x accounts | Adjusted by IL lever + other indirect lever (if applicable) |
| Fringe & Benefits | 61.xx + 62.xx + 63.xx + 64.xx | Proportional labor base scaling only (not in blanket lever) |
| Facilities (FAC) | 66.xx | Non-Labor lever only (held constant otherwise) |
| Indirect Expense | All 8x accounts | Non-Labor lever + bonus delta flow-through |
| Unallowable | All 9x accounts | Non-Labor lever only |
| Total Indirect | Sum of above 5 lines | Derived |
| Bonus — OH Award | 71.51.11 | Held constant (relatively stable) |
| Bonus — G&A Award | 81.51.11 | Auto-calc from GP change OR explicit override |
| Total Bonus | OH + G&A | Derived |
| Net Income | GP + Total Indirect + Custom Items | Derived |
| Reported EBITDA | NI + Interest + D&A + Taxes | D&A/Interest/Taxes held constant |
| EBITDA Adjustments | From ebitda_adjustments table | Held constant |
| Adjusted EBITDA | Reported + Adjustments | Derived |
| Debt Service | From debt_schedule | Held constant (conservative) |
| DSCR | Adj. EBITDA / Debt Service | Derived |
| Leverage | Total Funded Debt / Adj. EBITDA | Derived — funded debt includes rebalanced LOC |
Cash & LOC: The scenario engine runs a simplified annual cash waterfall. NI delta flows through to Cash from Operations, which changes preliminary cash. If preliminary cash falls below the $500K minimum, the LOC draws to cover the shortfall. If cash exceeds the minimum and the LOC has a balance, excess cash pays down the LOC. LOC balances carry forward year-to-year, and funded debt (term loan + LOC) is recalculated each year. This means downside scenarios show the compounding leverage effect: lower EBITDA + higher LOC draws = worse leverage than a naive flat-debt calculation. |
Ownership Model
- Each scenario has a
created_byfield - CEO can view/edit all scenarios
- COO can create/edit own, view CEO's read-only, and duplicate any
- CGO can view all read-only
Recording Outcomes
Record Outcome on a scenario opens a drawer where you mark it Won or
Lost, give the effective date, the Revenue Impact ($) and any notes. The same
drawer lists the outcomes already recorded for that scenario, newest first, so
what you enter is never write-only. Bid History in Pricing remains the
canonical win/loss view for bids; this log is scenario-level.
Key Tables
scenarios
Master scenario definitions.
| Column | Type | Description |
|---|---|---|
| id | INTEGER | Primary key |
| name | TEXT | Display name |
| description | TEXT | What this scenario models |
| color | TEXT | Color for charts |
| is_base | INTEGER | 1 = base case scenario, 0 = user scenario |
| created_at | TEXT | Creation timestamp |
| created_by | TEXT | Username who created it |
IMPORTANT: Column is name — NOT scenario_name. Column is is_base — NOT is_active.
scenario_adjustments
Individual adjustments within a scenario.
| Column | Type | Description |
|---|---|---|
| id | INTEGER | Primary key |
| scenario_id | INTEGER | FK → scenarios.id |
| adjustment_type | TEXT | See Adjustment Types above |
| label | TEXT | Display label for this adjustment |
| target | TEXT | What is being adjusted (account_code, division, contract) |
| fiscal_year | INTEGER | Year the adjustment applies (NULL = all years) |
| value | REAL | Percentage, dollar amount, or rate depending on type |
| metadata | TEXT | Additional parameters (JSON) |
| sort_order | INTEGER | Display ordering |
Valid adjustment_type values: revenue_pct, revenue_dollars, indirect_labor_pct, other_indirect_pct, bonus_override, fringe_rate_override, custom_item, contract_win, contract_loss
Contract-specific types (contract_win, contract_loss): The target field is unused (defaults to 'overall'). The metadata JSON stores structured data: for contract_win it contains {ceiling, start_date, months, margin_pct, source, opportunity_name}; for contract_loss it contains {contracts: [{id, name, loss_date, end_of_pop}]}. The fiscal_year field is always NULL — timing is derived from the metadata dates. The value field stores the estimated annual revenue impact for display purposes.
scenario_results
Computed P&L results per scenario (populated after scenario compute).
| Column | Type | Description |
|---|---|---|
| scenario_id | INTEGER | FK → scenarios.id |
| fiscal_year | INTEGER | Year |
| metric | TEXT | 'revenue', 'gross_profit', 'ebitda', 'net_income', etc. |
| amount | REAL | Computed value for this metric under this scenario |
IMPORTANT: scenario_results has only amount — NOT base_value, adjusted_value, or delta. To compare base vs scenario, query results for the base scenario (is_base=1) and the user scenario separately.
Common Queries
List all scenarios (excluding base case)
SELECT id, name, description, created_by, created_at
FROM scenarios
WHERE is_base = 0
ORDER BY created_at DESC;
Get adjustments for a specific scenario
SELECT adjustment_type, label, target, fiscal_year, value
FROM scenario_adjustments
WHERE scenario_id = ?
ORDER BY fiscal_year, sort_order;
Compare base case vs scenario results
SELECT base.fiscal_year, base.metric,
       base.amount as base_value,
       scen.amount as scenario_value,
       scen.amount - base.amount as delta
FROM scenario_results base
JOIN scenario_results scen ON base.fiscal_year = scen.fiscal_year
    AND base.metric = scen.metric
JOIN scenarios bs ON base.scenario_id = bs.id AND bs.is_base = 1
WHERE scen.scenario_id = ?
ORDER BY base.fiscal_year, base.metric;
Get fringe rates from Indirect Rates
SELECT fiscal_year, param_value
FROM forecast_parameters
WHERE param_key = 'fringe_rate_non_sca'
ORDER BY fiscal_year;
The 3 UI Tabs
The totals control names the view it will switch to, not the one you are in: By Year breaks the figures out per year, and 5-Year Total collapses them back to one number.
1. Build Scenarios
Create and edit scenarios with adjustments. Features include:
- Scenario selector with color-coded badges and Compute/Delete controls. A create or delete that fails says so beside Create, rather than leaving a row that simply did not disappear; a rename or description edit that fails stays open with what you typed
- New Scenario form with a name and an optional description
- Add Adjustment panel with type selector, label (auto-populated from type), the type's own inputs, and on most types a
Fiscal Yearfield: blank applies the lever to every forecast year, a year confines it to that year - Inline editing — click ✏️ on any existing adjustment to edit label, value, or fiscal year in place without deleting and re-adding
- Bonus Pool Change says under its amount to enter the change, not the new total: a negative number cuts the pool, and several bonus adjustments in one scenario add together
- Signs are typed, not toggled: enter a negative number for a decrease
The fields the Add Adjustment panel collects
Which inputs appear depends on the adjustment type you pick. Every type shares
Label / Description, which is pre-filled from the type and is what the
adjustment is called everywhere afterward, and a Cancel that closes the panel
without recording anything.
| Input | Appears for | What it sets |
|---|---|---|
Amount ($) | one-off items, and revenue changes entered in dollars | The dollar figure. On a revenue change the same input is headed Amount (%) when you switch the entry mode, so read the heading before typing. |
Annual Revenue ($) | contract win / loss | The contract's annual revenue the scenario adds or removes. |
Cost Change ($) | pricing changes | An annual dollar change to cost; positive raises cost. |
Rate Change (%) | Indirect Labor % Change | The percent change to indirect labor; -10 cuts it by 10%. |
Change to Bonus Pool ($) | Bonus Pool Change | The change to the pool, not the new total. Replaces the automatic gross-profit-driven recalculation. |
Value (primary %) | Market Condition | Not read; see above. |
Three pickers appear on the levers: Select contract..., Select pool... for an
indirect pool, and a division picker whose unset option reads Not specified.
Only Contract Loss reads its contract. The others record intent and do not
narrow what the lever computes (see the table above).
Not specified means the division was left unset. It does not mean every
division. The option used to read "All Divisions", which claimed a
scope-wide application the engine never performed. If you want a lever to
apply across divisions, that is a property of the adjustment type, not something
this picker grants.
A one-off item also carries a Category of Revenue, Cost or Below-the-line.
The category is recorded and the engine does not read it. Whichever you pick, a one-time item lands in the same flat-dollar bucket at operating income, so it moves net income AND EBITDA either way — the engine's own note says below-the-line items are held constant from base, so "EBITDA moves with it as well, since the EBITDA add-backs are constants."
This matters because the Covenant Dashboard is driven by Adjusted EBITDA.
Filing a one-time charge as Below-the-line in the belief that EBITDA is
protected will still move DSCR and leverage. See Fields the Form Collects That
the Engine Does Not Read — Category is listed there.
Auto-filling from a deal or an opportunity
Two selects populate the form from something you have already modeled rather than making you retype it:
Pipeline Opportunity (auto-fills the fields below)— pulls the opportunity's value and division. Its picker readsSelect opportunity or enter manually..., which is the honest phrasing: choosing nothing is a supported path, not an incomplete form.M&A Deal (auto-fills the fields below)— the same for a modeled deal, fromSelect deal or enter manually....
Auto-fill writes the fields once and then lets go. They stay editable, so you can start from the modeled figure and adjust it — and the scenario records what you typed, not what the source says today.
For a pipeline opportunity there is also an Outcome control with two
buttons, Won and Lost. It decides the direction of the modeled effect, which
is why it is a pair of buttons rather than a checkbox: there is no neutral
outcome to default to, and a scenario that has not chosen one is not a scenario.
Indirect Costs is one of the adjustment types in the selector, covering levers
that move an indirect pool rather than a contract.
2. Compare Results
Side-by-side comparison of base case vs. scenario P&L metrics. Includes:
- Metric tiles at the top showing Revenue, Gross Profit, Adj. EBITDA, Net Income, DSCR, and Leverage with dollar/ratio deltas and percentage changes vs base
- Year selector for metric tile display
- Adjustment Summary showing what levers each scenario pulled (icon, label, value, year)
- P&L Comparison table with base case column, scenario column, and delta column showing both dollar change and percentage change (e.g., "-$4,428 (-20.0%)")
- Delta sign convention — cost line deltas are shown from the business perspective: a cost decrease shows as negative (intuitive), not positive (GL convention)
- Adjusted EBITDA Trend table across all forecast years with delta columns
- Net Income Trend table across all forecast years with delta columns
- Tables expand per fiscal year with auto-sized heights
The tab is headed Scenario Comparison, and the same title carries into
full-screen view so you do not lose your place when you expand it.
The trend table is one panel headed EBITDA & Net Income Trend — both
measures in a single table rather than two, because the interesting question is
almost always how they move relative to each other.
Indirect rate impact
The Indirect rate impact table answers one question: what does each scenario do to the rates? Rows are cost pools, columns are scenarios, and every cell shows the rate that scenario produces next to how far it moved from the Baseline — the scenario marked as the base, which carries the rates plainly.
Five pools are listed: Fringe, Fringe (SCA), Overhead, Material handling and G&A.
The two wrap rates sit below a rule because they are produced by the pools above them, not peers of them. Wrap (non-SCA) and Wrap (SCA) are what the pools multiply out to. You do not move a wrap rate; you move a pool and the wrap follows. The separation is deliberate — read together they would look like five independent numbers when there are only three decisions.
There are two wraps because there are two fringe pools. Service Contract Act work carries its own fringe, so it carries its own wrap; the non-SCA wrap is the one that applies to everything else. Read the one that matches the work you are pricing.
Rates show two decimals on purpose: a tenth of a point is a real difference in a negotiation, not rounding noise.
3. Covenant Dashboard
Covenant compliance status under each scenario across the forecast horizon:
- DSCR section — Scenario-per-row table with FY columns, threshold legend, 🟢🟡🔴 status indicators with cushion amounts
- Leverage section — Same format as DSCR
- Cash & Liquidity — Ending Cash, Cash from Operations, and LOC Balance tables
- Status thresholds: 🟢 Green = ≥25% cushion above/below threshold, 🟡 Yellow = compliant but tight, 🔴 Red = covenant breach
Beside the DSCR and leverage figures the stress table prints the threshold each
is tested against — the leverage column's is headed Max, since leverage is
a ceiling. The value comes from your covenant definitions, not a default,
which is why it is shown per row instead of stated once.
Cash is its own panel, Cash & LOC Impact, covering ending cash, cash from
operations and the line-of-credit balance under each scenario.
Computation Flow
When "Compute" is clicked for a scenario, the engine runs this sequence per fiscal year:
- Load Base Case — Reads all account-level data from
pl_forecasts+ actuals, computes covenant data from three-statement engine - Revenue & Direct Costs — Applies revenue adjustments, scales DC proportionally (preserving GP margin)
- Fringe Cascade — Computes DL Non-SCA and DL SCA changes from DC scaling, computes IL labor change from IL lever, derives Non-SCA and SCA labor base ratios, scales each fringe pool by its ratio
- Indirect Non-Labor Distribution — Distributes non-labor indirect % change proportionally across FAC, Indirect Expense, and Unallowable only (based on their share of the discretionary indirect base). Fringe and Bonus are excluded from this distribution.
- Bonus Calculation — If bonus override exists: uses the override. Otherwise if GP changed: auto-calculates (CGO 4% of GP delta + 0.5% minor growth scaling). Bonus delta flows through Indirect Expense (8x)
- Roll Up — Computes Total Indirect, Net Income, EBITDA
- Cash Waterfall & LOC Rebalancing — NI delta flows through to Cash from Operations. Engine backs out the base case LOC effect to get preliminary cash (before LOC), applies the NI delta, then re-sizes the LOC: draws if cash falls below minimum ($500K), pays down if cash exceeds minimum and LOC balance > 0. Years are processed sequentially so LOC balance carries forward.
- Funded Debt & Covenants — Funded debt = term loan (held constant) + rebalanced LOC. Leverage = funded debt / Adj. EBITDA. DSCR = Adj. EBITDA / debt service. In downside scenarios, LOC increases drive funded debt higher at the same time EBITDA falls, creating a compounding leverage effect.
Covenant Stress Testing
Scenario Planning stress-tests covenants within the module itself. Build a downside scenario (for example, "20% Revenue Drop"), compute it, and the Covenant Dashboard (the covenants tab, described above) shows DSCR, leverage, and liquidity compliance for that scenario across the forecast horizon — so you can see which years breach a threshold before you commit to a plan.
Feeding a saved scenario directly into the separate Debt & Refinancing module as a stress overlay is not currently available — the two modules are computed independently today. Use the Covenant Dashboard above for scenario-level covenant analysis.
Relationships to Other Modules
- Income Statement → Scenarios read base case from
pl_forecasts; never write back - Financial Statements → Covenant recalculation uses
compute_covenants()from three-statement engine as single source of truth for DSCR, leverage, debt service, and funded debt - Indirect Rates → Fringe rates (
fringe_rate_non_sca,fringe_rate_sca) loaded fromforecast_parameterstable for cascade calculations - Dashboard → Base case scenario is refreshed during Compute All step 6
- M&A Module → M&A deals can have their own scenario overlays
- Debt Financing → Computed independently from Scenario Planning today; a scenario's stressed EBITDA does not feed the Debt & Refinancing module (use the Covenant Dashboard for scenario-level covenant stress-testing)
Important Notes for AI Query Routing
- Scenario questions should be routed to this documentation, NOT to SQL generation against the database
- The
scenario_resultstable stores flattened metric/amount pairs — it does not have separate base vs. adjusted columns - Fringe cascade math uses proportional scaling, not delta × rate multiplication
- The base case P&L separates Fringe (61-64) from FAC (66) — they are NOT combined under a single "fringe" line
- Indirect Labor and Indirect Non-Labor are non-overlapping levers by design
- Fringe and Bonus are never included in blanket percentage levers — they have their own auto-adjustment mechanisms
- LOC balance is dynamically rebalanced in scenarios — it is NOT held constant from the base case
- Funded debt = term loan (constant) + rebalanced LOC, so leverage reflects the cash waterfall impact
- All dollar values in the scenario engine are in raw dollars (not thousands) — the UI displays in $000s
- Contract Win/Loss adjustments use the
metadataJSON for structured parameters (dates, contract IDs, margins) — do not try to interpretvalueorfiscal_yearfor these types - Win X revenue is prorated by month across fiscal years based on start_date and duration — it does NOT use
fiscal_yearfrom scenario_adjustments - Lose X reads actual forecast_data for exact per-month revenue and cost subtraction — more precise than % levers
- A single scenario can mix all adjustment types (e.g., "Win Navy + cut indirect labor 5% + lose Air Force")