Income Statement — User Guide
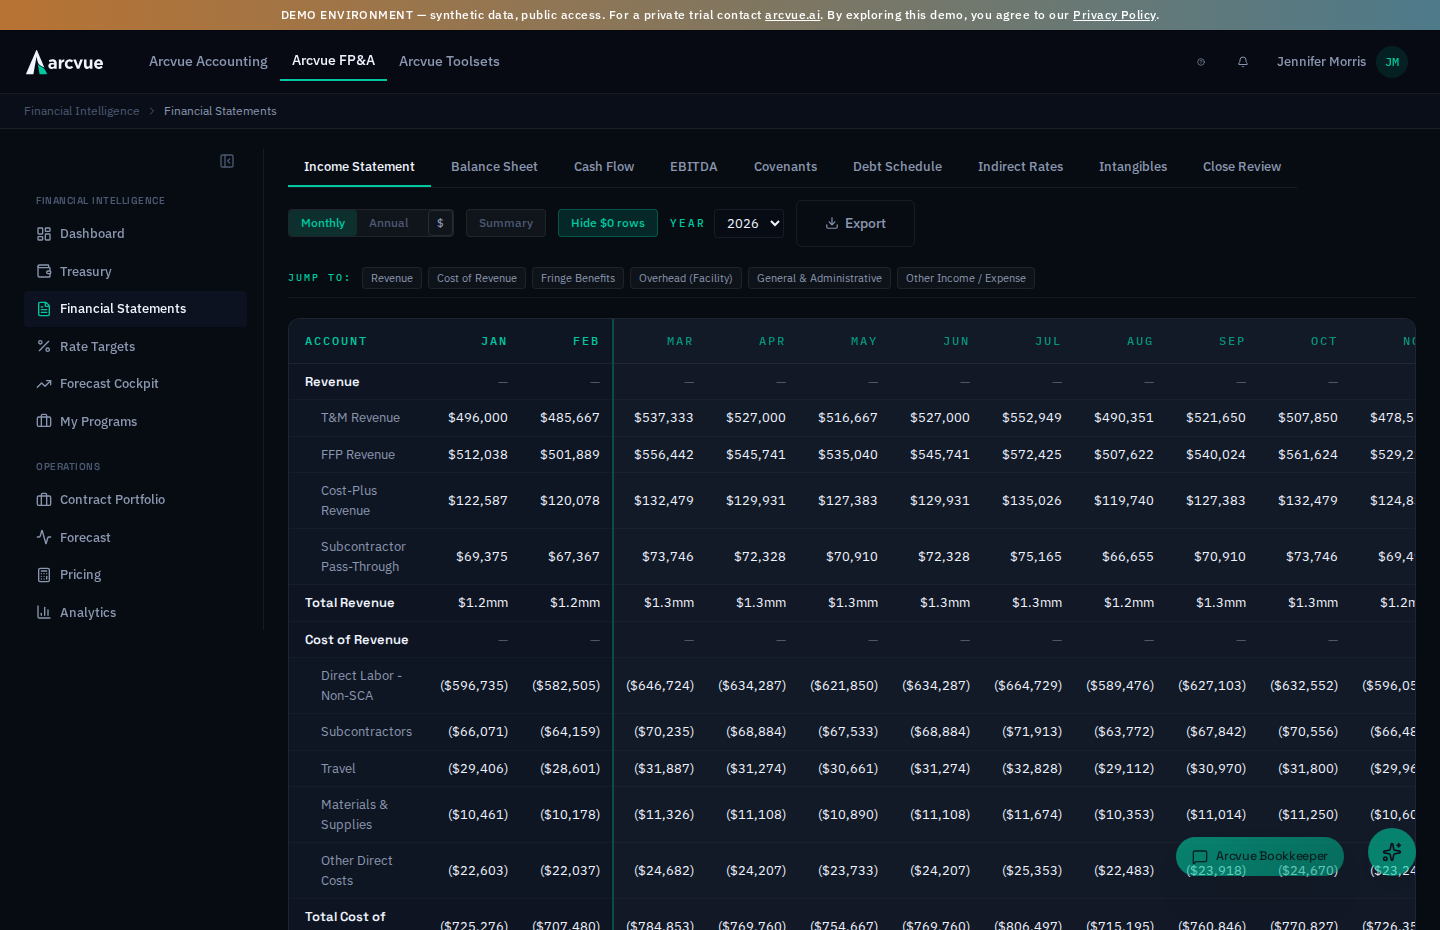
The Income Statement is the first tab of the Financial Statements page. It shows your consolidated Profit & Loss — revenue, direct costs, indirect costs, and net income — blending closed-month actuals with the platform's forward forecast in a single view. It is a read-only view: you do not edit P&L line items here (they are computed upstream), but you control how the numbers are grouped and displayed.
Who uses it: CEO, COO, and CFO. It is the primary financial view for the leadership team.
Finding it
In the left navigation, open Financial Intelligence → Financial Statements. The page opens on the Income Statement tab. Along the top you will also see the other statement tabs — Balance Sheet, Cash Flow, EBITDA, Covenants, Debt Schedule, Indirect Rates, and Intangibles (plus Close Review for CEO/CFO/Admin roles).
Reading the statement
The statement is a table: the Account column on the left, then one column per period. Rows are grouped into sections (Revenue, Direct Costs, the indirect pools, and the net-income subtotals), with section headers and subtotals shown in bold.
- Actuals vs. forecast is shown visually. Months that fall on or after the first forecast month are lightly shaded, and a teal line marks the boundary where closed actuals end and the forecast begins. Everything to the left of that line is real, closed-book data from your ERP; everything to the right is the platform's forecast.
- Section totals drill to their accounts. Any bucket row with accounts behind it — Total Revenue, Total Direct Costs, a pool subtotal, a section header — is underlined. Click it to see every GL account that rolls into that line. A line that nothing posts to in the selected year is left unclickable on purpose, rather than opening an empty drawer.
- EBITDA rows open the Bridge instead. The EBITDA subtotals have their own view: click one for the EBITDA Bridge drawer, which walks net income up to reported and adjusted EBITDA. They do not open the account list, because the question an EBITDA line raises is answered by a bridge rather than by a list of accounts.
- "Jump to:" links appear above the table (when there is more than one section) so you can jump straight to Revenue, a specific indirect pool, or the net-income lines.
Drilling into a line
Click any underlined line to open a drawer titled with that line's name, listing the GL accounts that roll into it. Each account shows its code and name, one column per month, and a full-year total. The accounts in the drawer sum to the line you clicked — that is what makes it a drill rather than a related view.
It works in Summary mode as well, which is where you are most likely to want it: collapse the statement to its buckets, then open the one that looks wrong.
Reading the drawer, and where a wrong number is actually fixed — this is the part worth knowing before you go looking:
- Unshaded months are actuals, booked to the general ledger. A figure that is wrong here is wrong in the ledger, and that is where it gets corrected.
- Shaded months are forecast, produced from that account's own forecast method. Each one is replaced by the booked figure when the month closes. To change one, edit the account's method in Forecast Inputs — the statement is derived, not typed, so there is nothing to edit on this page.
- Total is the full year, actual months plus forecast months. It is not year-to-date, so do not read it as money already spent.
- An account that does not belong on the line is mapped to that section in your chart of accounts. The fix belongs there, not on the statement.
If the drawer says no accounts post to this line in the selected year, that is a real answer about the year you are looking at, not an error — try another year.
Controls
The control bar above the statement lets you reshape the view:
- Monthly / Annual — switch between a 12-month (Jan–Dec) layout for one year and a multi-year column layout. The year range in Annual view is derived automatically from your data (earliest actual through your planning horizon).
- $ / $000s — toggle between full dollars and thousands.
- Summary — collapse the statement to just its bucket rows (Revenue, Direct Cost, Gross Profit, Fringe, Facilities, Material Handling, Overhead, G&A, Total Indirect, and the net-income lines).
- Hide $0 rows — hide any account whose values are all zero. On by default.
- Year — pick the fiscal year to show (Monthly view).
- Export — download the statement to Excel.
Where the revenue and costs come from
The forecast side of the Income Statement is assembled from a few upstream sources, so the numbers you see always tie back to work done elsewhere in the platform:
- Contract forecasts — revenue and direct costs from existing contracts, entered by Division Leads on the Forecast module.
- New-business / growth targets — revenue from anticipated new awards, set by the CEO on the Pipeline / BD page and spread into monthly amounts.
- Indirect forecasts — fringe, overhead, and G&A, computed from your indirect-rate configuration.
Depreciation & amortization flows in from the balance-sheet intangible schedule, and the CEO can layer one-off manual overrides on top. The closed-month side comes entirely from your ERP General Ledger. That ERP can be an external accounting system, or Arcvue Accounting itself: if you keep your books in Arcvue's own accounting product, it is a selectable ERP source that needs no separate connection to set up, and your closed-month actuals flow in from there. Either way the actuals refresh on the regular sync.
The boundary between the two is the books close date: months at or before the close show actuals; months after show forecast. Closing a month in Bookkeeping moves that line automatically.
When the statement cannot load
These statements could not be loaded means the request did not complete, so the page makes no claim about your results; reload the page. In the Annual layout, Annual data could not be loaded is the same failure for the multi-year view, while No annual data means the request worked and no multi-year statements have been generated for those years yet.
Related pages
- Balance Sheet, Cash Flow, Covenants — the other tabs of this page (see the Financial Statements guide).
- Indirect Rates — the read-only tab on this page showing your fringe, overhead and G&A rates per fiscal year, alongside the target tiles. It reports the rates; it does not configure them.
- Forecast and Pipeline / BD — where contract and new-business revenue originate.
- Scenario Planning — applies what-if overlays without touching the base forecast.
Technical reference
Data model, GL account structure, and example SQL (for developers and power users)
All P&L data originates from three upstream sources that flow into two core tables. Revenue on the Income Statement is the sum of three sources in pl_forecasts, tagged by a source field:
- Contract Forecasts (
source = 'contract_forecast') — Revenue and direct costs from existing contracts. Division Leads enter monthly forecasts on the Forecast Module page.forecast_rollup.pymaps these to GL account codes and writes topl_forecasts. - New Business / Growth Targets (
source = 'new_business') — Revenue from anticipated new awards not yet in the pipeline as contracts. CEO sets annual growth targets by division on the Pipeline/BD page. The system splits revenue into monthly amounts and allocates COGS across 7 GL accounts using historical actuals mix. - Indirect Forecasts (
source = 'indirect_forecast') — All indirect costs: fringe benefits (61–64.xx), overhead (71–76.xx), G&A/BD/B&P (81–86.xx), and other (92.xx). Computed byindirect_forecast_engine.pyusing 12 different forecast methods configured per GL account.
Additionally:
- D&A Schedule (
source = 'da_schedule') — Depreciation & amortization from the balance sheet intangible schedule. These accounts are excluded from the indirect engine to prevent double-counting. - Manual Overrides (
source = 'manual_override') — One-off adjustments entered by the CEO.
The Actuals vs. Forecast Boundary
The boundary between historical actuals and forecast data is controlled by the books close date stored in entity_close_dates. For example, if books are closed through December 2025:
- FY2025 and earlier: Data comes from
pl_actuals(ERP GL imports) - FY2026 and later: Data comes from
pl_forecasts(computed by the platform)
The Income Statement merges both tables seamlessly. Months before the close date show actuals; months after show forecast.
Key Tables
pl_actuals
Historical actuals imported from your ERP General Ledger via nightly sync.
| Column | Type | Description |
|---|---|---|
| entity | TEXT | Always 'CONSOLIDATED' for standard queries |
| fiscal_year | INTEGER | e.g., 2024, 2025 |
| fiscal_month | INTEGER | 1–12 |
| account_code | TEXT | GL account code, e.g., '41.11.11', '51.11.11' |
| amount | REAL | Revenue is POSITIVE, expenses are NEGATIVE |
| scenario | TEXT | 'actual' for real data, 'budget' for ERP budgets |
Important notes:
- Always filter
entity = 'CONSOLIDATED'andscenario = 'actual'for real financial data - Amounts follow accounting sign convention: revenue positive, costs negative
- Never filter by project status — closed projects contributed revenue during active periods
- Data is imported during the nightly scheduled sync
pl_forecasts
All forecasted amounts — contract revenue, direct costs, indirect costs, new business, D&A, and manual overrides.
| Column | Type | Description |
|---|---|---|
| entity | TEXT | Always 'CONSOLIDATED' — any module writing here MUST use this value |
| fiscal_year | INTEGER | e.g., 2026, 2027, 2028, 2029, 2030 |
| fiscal_month | INTEGER | 1–12 |
| account_code | TEXT | GL account code, e.g., '41.11.11', '71.11.11' |
| amount | REAL | Same sign convention: revenue positive, expenses negative |
| source | TEXT | Origin tag — see values below |
| source_detail | TEXT | Additional detail (e.g., contract name, division) |
Source values in pl_forecasts:
'contract_forecast'— Existing contract revenue and direct costs'indirect_forecast'— Fringe, overhead, G&A computed by indirect engine'new_business'— Growth target revenue and allocated COGS'da_schedule'— Depreciation & amortization from BS schedule'manual_override'— CEO one-off adjustments
pl_line_items
Lookup table mapping GL account codes to human-readable descriptions and display hierarchy.
| Column | Type | Description |
|---|---|---|
| account_code | TEXT | GL account code (primary key) |
| description | TEXT | Human-readable name, e.g., 'Non-SCA Direct Labor' |
| parent_code | TEXT | Parent in the hierarchy for subtotals |
| sort_order | INTEGER | Display ordering on Income Statement |
| tier | TEXT | Grouping tier for the indirect forecast config |
entity_close_dates
The authoritative source for the books close date — the boundary between actuals and forecast.
| Column | Type | Description |
|---|---|---|
| entity | TEXT | Use 'ALL' for the company-wide close date |
| accounting_close_date | TEXT | Date string, e.g., '2025-12-31' |
| close_fiscal_year | INTEGER | e.g., 2025 |
| close_fiscal_month | INTEGER | e.g., 12 |
Query the close date:
SELECT accounting_close_date, close_fiscal_year, close_fiscal_month
FROM entity_close_dates
WHERE entity = 'ALL';
GL Account Code Structure
The platform uses a hierarchical GL account code system: XX.YY.ZZ
| Range | Category | Examples |
|---|---|---|
| 4x.xx.xx | Revenue | 41.11.11 = Non-SCA Revenue, 42.11.11 = SCA Revenue |
| 51.xx.xx | Non-SCA Direct Labor | 51.11.11 = Non-SCA DL |
| 52.xx.xx | SCA Direct Labor | 52.11.11 = SCA DL |
| 53.xx.xx | Subcontractors / Consultants | 53.11.11 = Subs/Consultants |
| 54.xx.xx | Travel | 54.11.11 = Travel |
| 55.xx.xx | Materials / Supplies | 55.11.11 = Materials |
| 56.xx.xx | Other Direct Costs | 56.11.11 = Other DC |
| 61–62.xx | Non-SCA Fringe Benefits | 61.11.11 = FICA, 61.21.11 = Health Insurance |
| 63–64.xx | SCA Fringe Benefits | 63.11.11 = SCA FICA, 63.21.11 = SCA H&W |
| 66.xx.xx | Facility Costs | 66.11.11 = Rent, 66.21.11 = Utilities |
| 71–76.xx | Overhead | 71.11.11 = OH Labor, 71.51.11 = OH Awards |
| 81–86.xx | G&A / B&P / BD | 81.11.11 = G&A Labor, 82.11.11 = B&P, 83.11.11 = BD |
| 92.xx.xx | Other Income / Unallowables | 92.11.11 = Interest Income, 92.31.44 = Interest Expense |
Key groupings for indirect cost analysis:
- Fringe (non-SCA): account_code LIKE '61%' OR account_code LIKE '62%'
- Fringe (SCA): account_code LIKE '63%' OR account_code LIKE '64%'
- All Fringe: account_code LIKE '6%'
- Overhead: account_code LIKE '7%'
- G&A / B&P / BD: account_code LIKE '8%'
- Other / Unallowables: account_code LIKE '9%'
- All indirect costs: account_code LIKE '6%' OR '7%' OR '8%' OR '9%'
- Revenue: account_code LIKE '4%'
- Direct costs: account_code LIKE '5%'
Common Queries
Get all tables in this SQLite database
SELECT name FROM sqlite_master WHERE type='table' ORDER BY name;
Note: This is a SQLite database. Do NOT use MySQL syntax like SHOW TABLES or information_schema.columns. Use sqlite_master and PRAGMA commands.
Get columns for any table
PRAGMA table_info(pl_forecasts);
Get FY2026 revenue by month
SELECT fiscal_month, SUM(amount) as revenue
FROM pl_forecasts
WHERE entity = 'CONSOLIDATED'
  AND fiscal_year = 2026
  AND account_code LIKE '4%'
GROUP BY fiscal_month
ORDER BY fiscal_month;
Get FY2026 indirect costs by account, sorted by largest
SELECT f.account_code,
       COALESCE(p.description, f.account_code) as description,
       SUM(f.amount) as annual_total
FROM pl_forecasts f
LEFT JOIN pl_line_items p ON f.account_code = p.account_code
WHERE f.entity = 'CONSOLIDATED'
  AND f.fiscal_year = 2026
  AND (f.account_code LIKE '6%' OR f.account_code LIKE '7%'
       OR f.account_code LIKE '8%' OR f.account_code LIKE '9%')
GROUP BY f.account_code
ORDER BY ABS(SUM(f.amount)) DESC;
Compare FY2025 actuals to FY2026 forecast for indirect costs
SELECT COALESCE(a.account_code, f.account_code) as account_code,
       p.description,
       a.actual_total as fy2025_actual,
       f.forecast_total as fy2026_forecast,
       ROUND(f.forecast_total - COALESCE(a.actual_total, 0), 2) as variance
FROM (
    SELECT account_code, SUM(amount) as actual_total
    FROM pl_actuals
    WHERE fiscal_year = 2025 AND scenario = 'actual' AND entity = 'CONSOLIDATED'
      AND (account_code LIKE '6%' OR account_code LIKE '7%'
           OR account_code LIKE '8%' OR account_code LIKE '9%')
    GROUP BY account_code
) a
LEFT JOIN (
    SELECT account_code, SUM(amount) as forecast_total
    FROM pl_forecasts
    WHERE fiscal_year = 2026 AND entity = 'CONSOLIDATED'
      AND (account_code LIKE '6%' OR account_code LIKE '7%'
           OR account_code LIKE '8%' OR account_code LIKE '9%')
    GROUP BY account_code
) f ON a.account_code = f.account_code
LEFT JOIN pl_line_items p ON COALESCE(a.account_code, f.account_code) = p.account_code
ORDER BY ABS(COALESCE(f.forecast_total, 0)) DESC;
Get full P&L summary for a fiscal year (actuals or forecast)
-- For actuals year (e.g., 2025):
SELECT
    CASE
        WHEN account_code LIKE '4%' THEN 'Revenue'
        WHEN account_code LIKE '5%' THEN 'Direct Costs'
        WHEN account_code LIKE '6%' THEN 'Fringe Benefits'
        WHEN account_code LIKE '7%' THEN 'Overhead'
        WHEN account_code LIKE '8%' THEN 'G&A / B&P / BD'
        WHEN account_code LIKE '9%' THEN 'Other'
    END as category,
    SUM(amount) as total
FROM pl_actuals
WHERE fiscal_year = 2025 AND scenario = 'actual' AND entity = 'CONSOLIDATED'
GROUP BY category
ORDER BY category;
Get revenue by source for FY2026
SELECT source, SUM(amount) as revenue
FROM pl_forecasts
WHERE entity = 'CONSOLIDATED'
  AND fiscal_year = 2026
  AND account_code LIKE '4%'
GROUP BY source;
Monthly P&L trend (combining actuals + forecast)
-- Actuals months (before close date):
SELECT fiscal_year, fiscal_month, SUM(amount) as net_income
FROM pl_actuals
WHERE entity = 'CONSOLIDATED' AND scenario = 'actual'
GROUP BY fiscal_year, fiscal_month

UNION ALL

-- Forecast months (after close date):
SELECT fiscal_year, fiscal_month, SUM(amount) as net_income
FROM pl_forecasts
WHERE entity = 'CONSOLIDATED'
GROUP BY fiscal_year, fiscal_month

ORDER BY fiscal_year, fiscal_month;
Data Flow Diagram
ERP GL (nightly sync)
    |
pl_actuals (historical)
    |
    |--> Income Statement (actuals months)
    |--> Indirect Engine (trailing averages from actuals)

Forecast Module (Division Lead input)
    |
forecast_rollup.py
    |
pl_forecasts (source='contract_forecast')
    |
    |--> Income Statement (forecast months)

Pipeline/BD (CEO growth targets)
    |
new_business_rollup.py
    |
pl_forecasts (source='new_business')
    |
    |--> Income Statement (forecast months)

Indirect Rates (indirect config)
    |
indirect_forecast_engine.py
    |
pl_forecasts (source='indirect_forecast')
    |
    |--> Income Statement (forecast months)

D&A Schedule (balance sheet)
    |
pl_forecasts (source='da_schedule')
    |
    |--> Income Statement (forecast months)
Relationships to Other Modules
- Forecast Module → Writes revenue + direct costs to
pl_forecasts(source='contract_forecast') - Pipeline/BD → Writes growth target revenue + COGS to
pl_forecasts(source='new_business') - Indirect Rates → Configures how each indirect GL account is forecasted; engine writes to
pl_forecasts(source='indirect_forecast') - Financial Statements (BS/CFS) → Reads net income from P&L to drive retained earnings, cash flow, and covenant calculations
- Scenario Planning → Applies overlay adjustments to P&L data (never modifies base forecast)
- Reporting → All reporting tabs pull P&L data from these same tables
- Dashboard → Hero metrics (revenue, EBITDA, net income) computed from pl_actuals + pl_forecasts