Financial Statements — Controller Guide
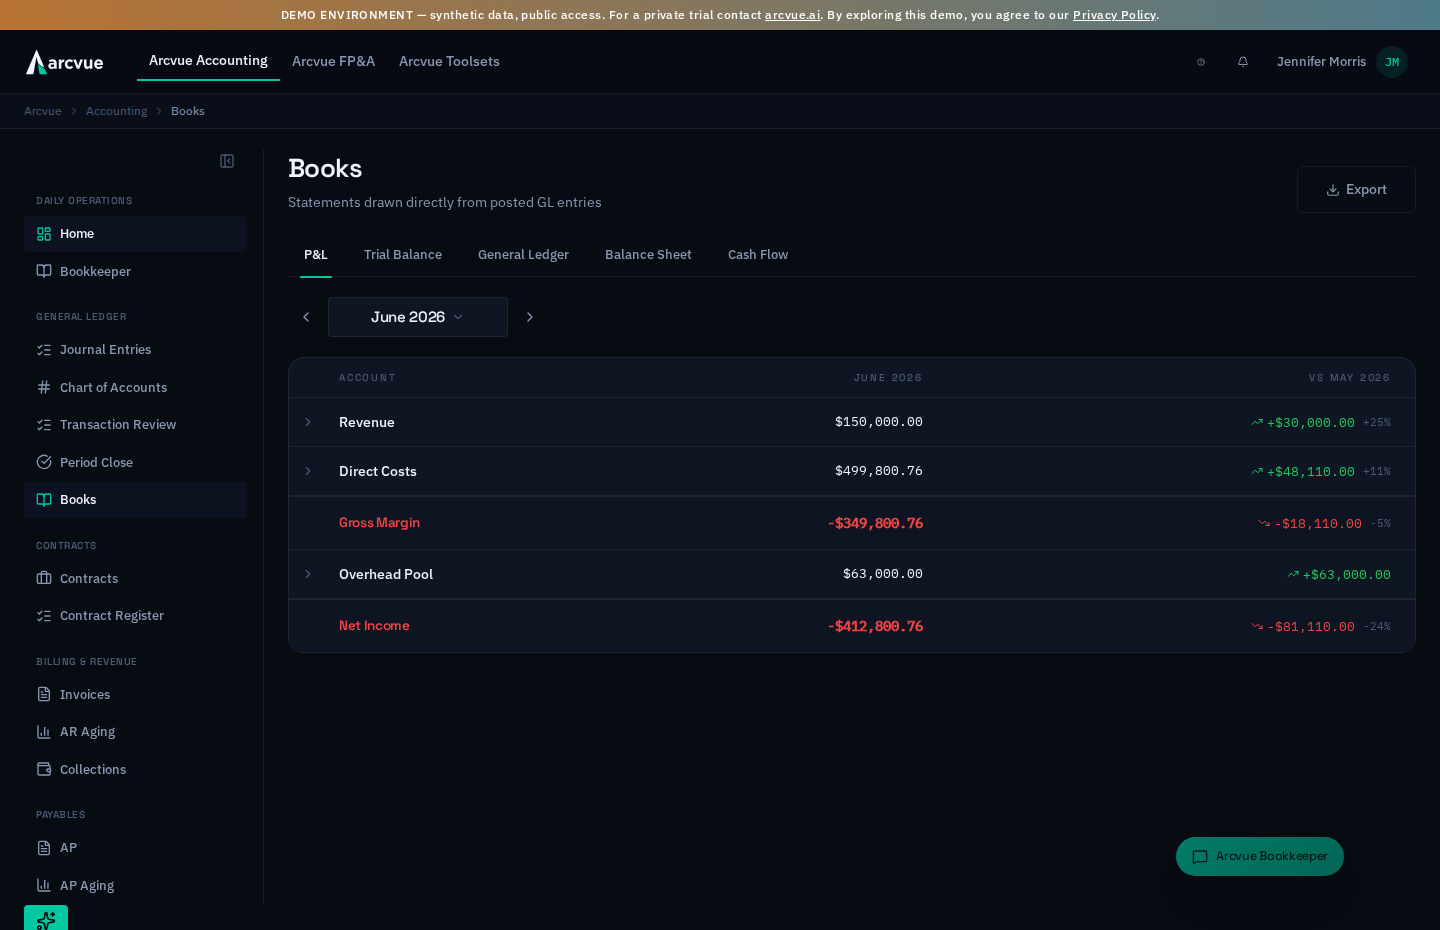
The financial statements are the standard views of your business — the income statement (are you profitable?), the balance sheet (what do you own and owe?), and the cash flow statement (where did the cash go?) — plus the trial balance and general ledger that prove they all tie. In Arcvue they all live on one page called Books. This guide explains what each view tells you, then walks the exact clicks to pull them, drill into them, and read them with confidence. It assumes you run a business but aren't necessarily a career accountant.
For: controllers · Time: ~10 minutes · You'll need: the Accounting module.
Left nav: Accounting → General Ledger → Books (/accounting/books). One page holds all five views as tabs — P&L, Trial Balance, General Ledger, Balance Sheet, and Cash Flow. Each tab deep-links, so /accounting/books?tab=balance-sheet opens straight to the balance sheet.
Part 1 — The ideas you need first (read once)
The five views (and what each answers)
- P&L (Income Statement) — revenue minus expenses over a period. Your profitability for the month. Arcvue lays it out the GovCon way: Revenue, Direct Costs, Gross Margin, then the indirect pools (Fringe, Overhead, G&A), Other Expenses, and Net Income. A business whose Organization Type is commercial keeps no indirect-rate pools, so the same sections read Fringe Benefits, Overhead and Operating Expenses, on screen and in the export alike (see First-Run Setup for where the organization type is set).
- Trial Balance — every account's ending balance in one list, total debits vs. total credits. It's the proof the books are internally consistent and the raw material the statements are built from.
- General Ledger (GL) — the transaction-level detail: pick any account and see every entry that hit it in the period.
- Balance Sheet — assets, liabilities, and equity as of the period-end date. What you own, owe, and are worth at a point in time. It always balances: assets = liabilities + equity.
- Cash Flow — how cash actually moved, split into operating, investing, and financing. Profit and cash aren't the same thing; this reconciles the two.
They're built from the ledger — not typed in
Every view is computed straight from posted GL entries. The page subtitle says it plainly: "Statements drawn directly from posted GL entries." Two pieces of the chart of accounts do the sorting:
- Account type (asset / liability / equity / revenue / expense) decides whether an account lands on the balance sheet or the P&L.
- Cash-flow category (operating / investing / financing / cash) decides where a balance-sheet account's change shows up on the cash flow statement.
That means your statements are only as well-organized as your chart. An account with the wrong type shows up in the wrong section; a balance-sheet account with no cash-flow category is invisible to the cash flow statement — and Arcvue will tell you when that happens (see Part 3).
Actuals, and reading a closed month
The Balance Sheet and Cash Flow views always render in actuals mode — posted entries only. That's what makes a closed month audit-grade: it reads the same every time. The page opens on the most recently closed (or locked) month, which is what you want for reporting; a company that has not closed a month yet opens on the newest month that holds posted entries. If you point it at the current in-progress month, Arcvue shows an amber note that the vs-prior comparison reflects only partial activity so far.
What Arcvue deliberately will not do
- It won't fabricate a number to make a statement tie — if the trial balance is off, it says so, so you can find the cause.
- It won't reclassify your accounts for you — statement placement follows the chart's type and cash-flow category, which you control in Chart of Accounts.
Part 2 — How to run it (click by click)
Step 1 — Open Books and set the period
In the left nav go to Accounting → General Ledger → Books. The page header reads Books with the subtitle "Statements drawn directly from posted GL entries."
The period picker sits just under the tab row, on the left: ← [Month Year ▾] →.
- Click ← or → to step one month at a time.
- Click the month/year button (e.g. May 2026 ▾) to open a calendar popover. Use the ‹ / › arrows to change the year, then click a three-letter month (Jan, Feb, …) to jump.
Arcvue opens on your most recently closed month by default (or, before any month has closed, the newest month with posted entries), so you usually don't need to touch this for a standard close review.
If your books carry more than one legal entity, an entity toggle appears to the right of the period picker — a pill row (e.g. All /
Step 2 — Prove the books tie: Trial Balance
Click the Trial Balance tab. Above the table a one-line status reads "N accounts · balanced" in green — or, if something is off, "out of balance by $X.XX" in red. Read this first: a balanced TB means every statement built on it is internally consistent.
The table lists Account · Name · Type · Debit · Credit · Vs Prior, with a bold Totals row at the bottom where total debits should equal total credits. The Vs Prior column shows each account's movement since the prior month-end with an up/down arrow.
- Toggle Show inactive accounts (checkbox, top-right) to include zero-balance accounts you'd normally hide.
- Click any row to open the Transaction Drawer on that account (see Step 5).
Step 3 — Read the P&L
Click the P&L tab. Above the table is the Statement scope switch — month / Year to date: the left button names the month you selected, the right one shows the same statement for the financial year so far, up to and including that month. It opens on the single month.
Year to date follows your financial year, not the calendar. If your year ends 30 September, asking for December shows October onward — not January onward. The same definition the income statement uses, so the two cannot disagree.
Two things change when you switch, and both are deliberate:
- The amount column heading becomes Year to
, and every figure on the statement moves with it — the section rows, the pool totals, Gross Margin and Net Income. Expanding a section still lists the individual accounts, each showing its year-to-date amount. - The vs-prior column goes blank. There is no year-to-date figure for the prior period to compare against, so the statement shows an em dash rather than leaving the month's percentage sitting beside a year-to-date number it is not a comparison of. A blank there is the report being honest, not a missing figure.
An account that was spent earlier in the year and had no activity in the month you selected still appears under Year to date, with a zero in its month. That is what makes the column add up to its own lines.
The statement is a single table with columns Account ·
Revenue → Direct Costs → Gross Margin → Fringe Pool → Overhead Pool → G&A Pool → Other Expenses → Net Income. (For a commercial business the three pools read Fringe Benefits, Overhead and Operating Expenses.)
Gross Margin and Net Income are bold subtotal rows and turn green when positive, red when negative. The vs prior column carries an up/down arrow and a percentage so you can see what moved. The arrow and the color are two different facts. The arrow is the direction of the change. The color says whether that change is good for the business. Revenue going up is a green up arrow; a cost going up is an up arrow in red, and a cost going down is green. So an up arrow can be red, and that is the screen working as intended.
To go deeper:
- Click a section row (e.g. Revenue, Overhead Pool) — the chevron flips down and the section expands to its individual GL accounts, each with its own account number, current amount, and vs-prior delta.
- Click an individual account line to open the Transaction Drawer and see the entries behind it (Step 5).
Ask each subtotal the right question: is Gross Margin the margin you expected? Any expense line out of line versus last month?
Step 4 — Balance Sheet and Cash Flow
Click the Balance Sheet tab. Its header shows the As of date (the last day of the selected month). Sections are Assets, Liabilities, Equity — click a section title (chevron) to expand its accounts. Total Assets closes the Assets section, part-way down; Total Liabilities + Equity is the last row of the statement. The two should match. If the accounting equation doesn't tie, an amber "Imbalance · $X.XX" badge appears in the header — that's your signal to investigate at the source.
Each expanded Balance Sheet line shows its account number as a hint, so you can always tell which GL account a figure came from. To see the transactions behind a figure, open the same account from the Trial Balance or General Ledger tab (Step 5).
A few lines carry no account number, because Arcvue derives them rather than reading one account:
- Retained Earnings — Cumulative Prior Years carries the earnings of years already ended.
- Retained Earnings — Year to Date carries the net income posted so far this year.
- Due to … — entity not in these books (or Due from …) appears when another company's entries touch these books but that company is not part of them. It carries the position with that company, and without it the statement would not balance.
Click the Cash Flow tab. Three cards across the top show Beginning cash · Net change · Ending cash. Below, three expandable sections — Operating, Investing, Financing — roll up to Net change in cash (green when positive, red when negative). Click a section title to see the line items driving it. Operating cash should broadly track profitability over time; big swings in investing/financing explain equipment purchases or debt draws.
If a balance-sheet account with no cash-flow category moved this period, a warning banner appears at the top of this tab: "N balance-sheet account(s) moved this period with no cash-flow category", listing the accounts. Their movement is left out of the statement, so fix them before trusting it (Part 3). An uncategorized account that did not move changes nothing, so it is not counted.
Step 5 — Drill to the transactions (the Drawer and the GL tab)
Two ways to reach transaction detail:
The Transaction Drawer — from the P&L or Trial Balance, click an account. A panel slides in from the right showing that account for the period: Debit / Credit / Net totals across the top, then every entry with Date · Description · Source · Debit · Credit · Balance. The Source pill tells you where each entry came from — Bank feed, Payroll, Timecard, Manual JE, your prior-system mirror, or Other. Descriptions that carry a linked document are clickable. Busy accounts page 250 entries at a time via Previous / Next. Press Esc or click the scrim to close.
The General Ledger tab — click General Ledger for a dedicated two-column browser. On the left, a Find account… search box and the full chart grouped by type (Assets, Liabilities, Equity, Revenue, Expenses…). Click an account and the right panel loads its Net balance plus Debit / Credit / Entries counts and the same entry table. This is the fastest way to inspect one account in depth — including the balance-sheet and cash-flow accounts you were just reading.
Click any entry row to jump to the record behind it — the journal entry, or the item in the Bookkeeper, depending on where the line came from. Some rows won't respond, and that is deliberate rather than broken: a leg carried in from your prior-system mirror has no journal entry and no transaction behind it, so those rows show no pointer and accept no click. A row that does nothing would be worse than one that plainly offers nothing.
Step 6 — Export for the file
On the P&L, Trial Balance and General Ledger tabs, an Export button sits at the top-right of the header — it downloads that view for the selected period (and entity) as an Excel workbook. On the Balance Sheet and Cash Flow tabs the Export button is present but disabled, and its tooltip names the tabs that do export: those two statements have no workbook of their own yet, so there is nothing to download rather than a download that would fail.
The three controls that move you around this page have no visible text,
so they are worth naming. The chevrons either side of the period are
Previous period and Next period — that is what a screen reader says
and what to look for when the arrows are not obvious. Close drawer is the
name of the dimmed area itself: the scrim is the button, so clicking
anywhere outside the drawer closes it — you do not have to find an ✕.
Part 3 — When something looks wrong
| Symptom | What it means | Fix |
|---|---|---|
| Trial Balance reads "out of balance by $X" (red) | The ledger itself is off, not the statement. Arcvue gates against posting unbalanced entries, so this is rare and worth a hard look. | Click into the accounts on the TB to find the one-sided entry via the drawer. Don't trust any statement until the TB reads balanced (green). |
| An account is in the wrong section of a statement | Its account type is wrong (e.g. an expense coded as an asset lands on the Balance Sheet instead of the P&L). | Fix the type in Accounting → General Ledger → Chart of Accounts (/accounting/admin/chart-of-accounts); the statement re-sorts. |
| Cash Flow shows the "moved this period with no cash-flow category" banner | Those balance-sheet accounts moved this period, and their movement is left out of the CFS, so the statement is incomplete. | Set each listed account's cash-flow category in Chart of Accounts. The CFS picks them up automatically. |
| The Balance Sheet or Cash Flow tab says it could not be loaded | The request for the statement failed; the books themselves are not affected. | Click Retry. If the message offers no Retry, the request was refused rather than failed, and the message says why. |
| Balance Sheet shows the amber "Imbalance · $X" badge | The accounting equation residual is non-zero — assets ≠ liabilities + equity as computed. | Investigate at the source: usually an entry posted to an account with the wrong type, or a missing equity/retained-earnings entry. Reconcile via the General Ledger tab and Chart of Accounts. |
| A statement doesn't match what I see in the raw books | Check the period and timing. Recognized-but-unbilled revenue or an accrual that reverses next month legitimately make an accrual statement differ from a cash view. | Confirm you're on the right month, and remember a closed month is fixed while an open one moves as you post — that's accrual accounting doing its job. |
| P&L vs-prior looks half-baked | You're on the current in-progress month; Arcvue shows an amber note that the comparison reflects partial activity. | Step the period picker back to the last closed month for a settled, reportable view. |
One-line summary
All five views — P&L, Trial Balance, General Ledger, Balance Sheet, and Cash Flow — live on Accounting → General Ledger → Books, computed straight from posted GL entries and sorted by each account's type and cash-flow category. Set the period, read the Trial Balance first to confirm it's balanced, then work each tab for the question it answers and click any account to drill to the transactions behind it.
Related
- Freeze the month these statements report → Close a Month (Period Close)
- Where account type and cash-flow category are set → Admin: Chart of Accounts
- How the indirect pools on the P&L are built → Indirect Rates